Table of Contents
- Why Does a Marketing Pipeline Forecast Built on MQL Volume Fail?
- Which Pipeline Forecast Inputs Still Work When Engagement Is Dark?
- How Do You Set a Pipeline Coverage Ratio by Stage and Cycle Length?
- What Is Buying Group Coverage and Why Does It Predict Revenue in B2B?
- Why Should B2B Pipeline Conversion Be Measured by Account Tier, Not Channel?
- How Do You Build a Marketing Pipeline Forecast Range Instead of a Single Number?
- What Forecast Confidence Language Does a Board Actually Understand?
- How Often Should RevOps Teams Reforecast Marketing Pipeline?
- When Does This Pipeline Forecasting Model Break Down?
- Frequently Asked Questions
Need help with B2B Marketing?
Let the smarketers’ team drive your pipeline with data-led campaigns and AI-powered growth strategies.
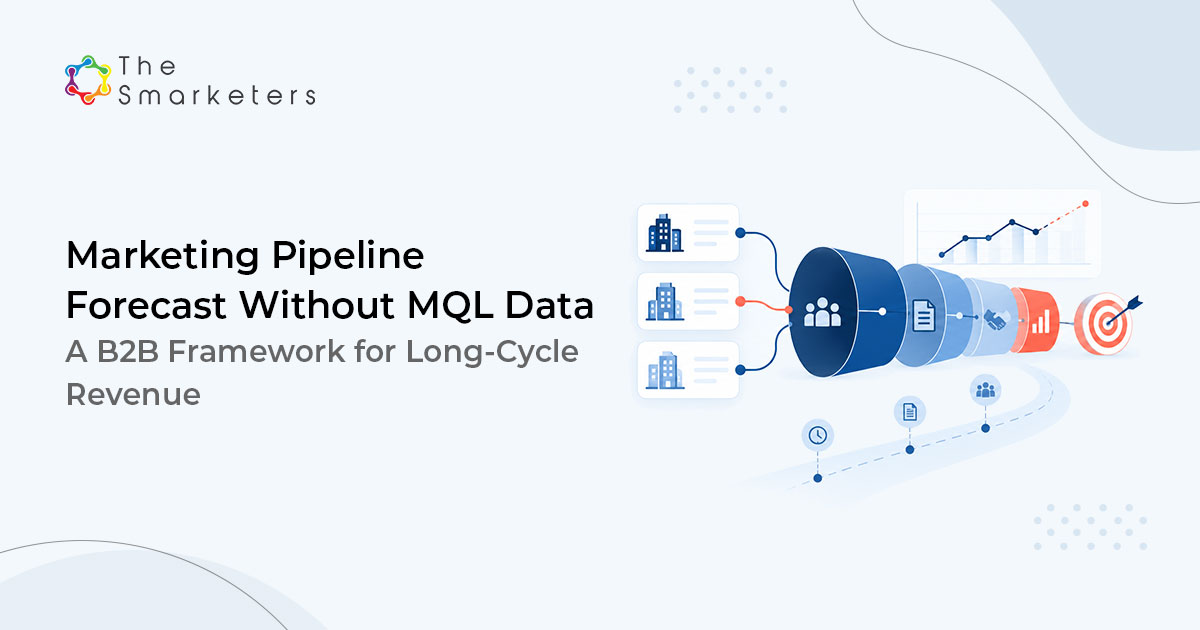
The marketing pipeline forecast most B2B teams still present works backwards from lead volume: so many MQLs, times a conversion rate, times an average deal size. That chain broke when the early buying process stopped producing observable engagement. When engagement volume no longer predicts revenue, forecast instead from pipeline coverage by stage, buying-group coverage on open deals, and historical conversion by account tier, then report a range with a stated confidence level rather than a single number.
The marketing pipeline forecast model that replaces MQL volume uses three inputs: pipeline coverage by stage, buying-group coverage on open deals, and tier-level historical conversion. It produces a range with named assumptions rather than a single number, and it holds even when buyer engagement has moved off measurable surfaces.
We rebuilt the forecast this way for an enterprise technology client running an eight-month average cycle – the same structural fix we apply in RevOps for IT services companies where SOW-based revenue makes MQL volume particularly unreliable. Their previous model had missed three consecutive quarters in the same direction, which is usually a sign of a structural error rather than bad luck.
Why Does a Marketing Pipeline Forecast Built on MQL Volume Fail?
Two things happened at once. Buyers stopped identifying themselves early, and the evidence trail moved off measurable surfaces.
STAT
67% of B2B buyers prefer a rep-free experience, yet 69% still turn to sales reps to validate AI-generated insights, and buyers use an average of seven information sources. Sources: Gartner, surveys of 645 to 646 B2B buyers, released March and May 2026.
A buyer using seven sources and preferring not to speak to anyone will generate almost no measurable engagement until late. Meanwhile Forrester reported in 2026 that 8 of the top 12 criteria used to judge B2B marketing still rely on engagement proof. The measurement system and the buying behaviour have separated, and the forecast sits on the wrong side of that gap.
The practical failure is directional bias. Lead-based models miss in the same direction repeatedly, because the input they measure is shrinking while the revenue it is meant to predict is not.
Which Pipeline Forecast Inputs Still Work When Engagement Is Dark?
Three survive, and they share a property. They describe deals that already exist, not interest that might become one.
Three forecast inputs reliably predict long-cycle B2B revenue when engagement proof is absent. Stage coverage ratio measures open pipeline value against the target by stage – it works because it relies on committed opportunity records, not inferred interest. Buying-group coverage measures the share of open deals with multiple decision roles actively engaged – it moves 60 to 120 days before stage changes. Tier-level historical conversion tracks win rate and cycle length by account tier – it stays stable even when channel mix changes completely.
| Input | What it measures | Why it still works |
|---|---|---|
| Stage coverage ratio | Open pipeline value against target, by stage | Based on committed opportunity records, not on inferred interest |
| Buying-group coverage | Share of open deals with multiple decision roles active | Moves 60 to 120 days before stage change in long cycles |
| Tier-level historical conversion | Win rate and cycle length by account tier | Stable within a tier even when channel mix changes completely |
Everything else is commentary. Traffic, impressions, content consumption and campaign response can explain a movement after the fact, but none belong in the arithmetic of a long-cycle forecast.
How Do You Set a Pipeline Coverage Ratio by Stage and Cycle Length?
The pipeline coverage ratio in B2B is calculated by dividing open pipeline value by the revenue target for the same period. In long-cycle B2B sales, the right ratio rises with cycle length, because more time means more chances to lose.
| Average cycle length | Coverage at qualified stage | Coverage at late stage | Reforecast frequency |
|---|---|---|---|
| Under 6 months | 3.0x | 1.6x | Monthly |
| 6 to 12 months | 4.0x | 1.8x | Monthly |
| 12 to 18 months | 5.0x | 2.0x | Quarterly |
| Over 18 months | 6.0x or higher | 2.2x | Quarterly |
Derive your own numbers rather than using these directly. Take two years of closed deals, calculate stage-to-close conversion for each stage, and invert it. If 22% of qualified-stage deals close, your qualified coverage requirement is 4.5x. The demand generation funnel calculator does the same arithmetic if you would rather not build it in a spreadsheet.
One warning. Coverage calculated on total pipeline including stalled deals is the most common way teams flatter themselves. Exclude anything with no activity in a period equal to a third of your average cycle.
VISUAL 1 · CAPTURE THIS
Screenshot of a HubSpot forecast report filtered to one pipeline stage, with the deal list beneath it, annotated to show which deals were excluded as stalled and the coverage ratio recalculated with and without them.
What Is Buying Group Coverage and Why Does It Predict Revenue in B2B?
Buying-group coverage is the share of open deals where a defined number of labelled decision roles have been active within the last 90 days. It is a leading indicator in long-cycle B2B sales because committees assemble before deals advance – buying-group coverage typically moves 60 to 120 days before a stage change appears in the CRM. Four active roles is a practical starting threshold for most enterprise technology deals.
Because deal progress in a long cycle depends on the committee assembling, and the committee assembles before the stage changes.
STAT
The average B2B buying decision now involves 13 internal stakeholders and 9 external influencers, and procurement is a decision-maker in 53% of cycles. Source: Forrester, State of Business Buying, January 2026.
Measure it as the share of open deals where a set number of labelled decision roles have been active within 90 days. Four roles is a reasonable starting threshold. Track it monthly against stage movement 60 to 120 days later. In the accounts we work on, deals that add a second and third role progress materially more often than deals with one engaged contact – which is why buying committee marketing is built around role coverage as a primary signal, not lead count.
The operational value is that this metric is actionable. A coverage ratio tells you the pipeline is thin; buying-group coverage tells you which deals to work and which roles are missing.
VISUAL 2 · CAPTURE THIS
Screenshot of a HubSpot deal record showing the associated contacts panel with role labels applied, alongside a saved list view of open deals sorted by number of active roles, annotated to mark the four-role threshold.
PROOF POINT
For a Fortune 500 technology client, we shifted the reporting unit from leads to sales-qualified accounts with multiple engaged roles, and the programme produced more than 150 sales-qualified accounts within 8 months. The forecast was built on those accounts and their role coverage rather than on lead volume.
Why Should B2B Pipeline Conversion Be Measured by Account Tier, Not Channel?
Channel-level conversion rates are unstable in long cycles because attribution decays before the deal closes. Account tier is stable, because it is a property of the account rather than of the touch.
| Tier | Definition | Typical treatment | What to hold constant |
|---|---|---|---|
| Tier 1 | Named strategic accounts, bespoke programme | One-to-one | Win rate and cycle length by tier |
| Tier 2 | Segment fit, clustered programme | One-to-few | Conversion by stage |
| Tier 3 | Broad ICP fit, programmatic | One-to-many | Volume and qualification rate |
Calculate win rate, average deal value and cycle length separately for each tier and use those in the forecast. Blending them produces an average that describes no actual deal, and in most portfolios the tier 1 numbers differ from tier 3 by a factor of several.
How Do You Build a Marketing Pipeline Forecast Range Instead of a Single Number?
A reliable B2B revenue forecast takes those three inputs and produces three scenarios from the same pipeline, differing only in the conversion assumption. A B2B revenue forecast range has three scenarios built from the same pipeline data, varying only in the conversion assumption applied: Downside uses the worst stage conversion rate from the last eight quarters. Expected uses the trailing four-quarter average, adjusted for known tier mix changes. Upside applies the best observed rate only to deals with full buying-group coverage. Each scenario names its assumption so the board can challenge the input rather than debate the total.
- Downside uses the worst stage conversion rate observed in the last eight quarters.
- Expected uses the trailing four-quarter average, adjusted for any known change in tier mix.
- Upside uses the best observed rate, applied only to deals with full buying-group coverage.
State each scenario with the assumption attached, so that a board member can challenge the assumption rather than the number. A forecast presented as a single figure invites a debate about whether it is right. A forecast presented as a range with named assumptions invites a debate about the assumptions, which is the more useful conversation.
KEY TAKEAWAY
Report the range, the assumption behind each end of it, and the specific events that would resolve the uncertainty. Leadership does not need a point estimate; they need to know when they will know.
What Forecast Confidence Language Does a Board Actually Understand?
Avoid statistical confidence intervals unless your deal count genuinely supports them. Below about 100 closed deals a year the interval is wide enough to be meaningless, and quoting one implies a precision you do not have.
Use plain bands instead, and define them once.
| Band | Meaning | Typical use |
|---|---|---|
| Commit | We expect this to close, decision date known | Board and finance planning |
| Likely | Probable, but one material dependency is unresolved | Resourcing decisions |
| Possible | Real opportunity, timing uncertain | Capacity awareness only |
How Often Should RevOps Teams Reforecast Marketing Pipeline?
Match the cadence to the cycle. A quarterly reforecast on a 4-month cycle is too slow, and a monthly reforecast on a 24-month cycle mostly generates noise and meetings.
Reforecast monthly for cycles under a year and quarterly above it, with one exception. Any change in buying-group coverage of more than 10 percentage points triggers an immediate review regardless of the calendar, because that is the input that moves first. A well-structured marketing pipeline forecast sits naturally inside a broader RevOps operating rhythm rather than as a separate marketing exercise.
When Does This Pipeline Forecasting Model Break Down?
It needs deal history. Below roughly 40 closed deals across two years, tier-level conversion rates are too noisy to forecast from, and a simple coverage ratio with a wide stated range is more honest than a modelled scenario.
It assumes association labels are maintained. If nobody labels the buying-group roles on deals, coverage becomes a measure of CRM data quality rather than of buyer behaviour.
It also cannot forecast a new category or a new region with no history. There the only defensible approach is a stated assumption set with an explicit note that the forecast is an estimate, revisited after the first two closed deals.
And it will not tell you which marketing programme created the pipeline. This is a forecasting model, not an attribution model – for the signal layer that sits upstream of it, see signal-based selling for dark funnel pipeline. Conflating the two is how teams end up with a forecast that is politically negotiated rather than calculated.
Frequently Asked Questions
How do you forecast marketing pipeline without engagement data?
Forecast from what already exists in the CRM rather than from interest signals. Use pipeline coverage by stage, buying-group coverage on open deals, and historical conversion by account tier. Present three scenarios built on named conversion assumptions rather than one number, so the assumption can be challenged instead of the total.
What is a good pipeline coverage ratio in B2B?
It depends on cycle length. Around 3x at qualified stage for cycles under six months, rising to 5x or 6x beyond twelve months, because longer cycles give more opportunity for deals to fail. Derive your own figure by inverting your stage-to-close conversion rate over two years of closed deals.
What is buying-group coverage and why does it predict revenue?
It is the share of open deals where a defined number of labelled decision roles have been active within 90 days. It leads stage movement by roughly 60 to 120 days in long cycles, because committees assemble before deals advance. Four active roles is a reasonable starting threshold.
Should pipeline conversion be measured by channel or by account tier?
By tier. Channel-level conversion is unstable across a long cycle because the attribution data decays before close. Account tier is a property of the account rather than of a touch, so win rate and cycle length stay comparable across periods even when channel mix changes completely.
How often should a B2B pipeline forecast be updated?
Monthly for cycles under twelve months, quarterly for longer ones, with one exception. A shift in buying-group coverage of more than ten percentage points should trigger an immediate review, because it is the input that moves earliest and it moves before anything visible in stage data.
Should we report a confidence interval to the board?
Only if your deal count supports it. Below roughly 100 closed deals a year the interval is too wide to be useful and implies false precision. Defined bands such as commit, likely and possible communicate the same uncertainty in language a board can act on.

Enoch Pakanati
CEO