Table of Contents
- What Do AI Citation Benchmarks Actually Measure?
- AI Citation Benchmarks by Vertical: Full Breakdown
- Why Are Cybersecurity AI Citation Benchmarks Higher Than Professional Services?
- How Much Does Market Affect Your AI Citation Benchmarks?
- How AI Overview Incidence Affects Citation Rate Measurement
- How do you set a target the board will accept?
- What Moves AI Citation Benchmarks? Four Levers Ranked by Effect
- Why You Must Rebaseline AI Citation Benchmarks Every Quarter
- When AI Citation Benchmarks Don’t Apply to Your Situation
- Frequently Asked Questions
Need help with B2B Marketing?
Let the smarketers’ team drive your pipeline with data-led campaigns and AI-powered growth strategies.
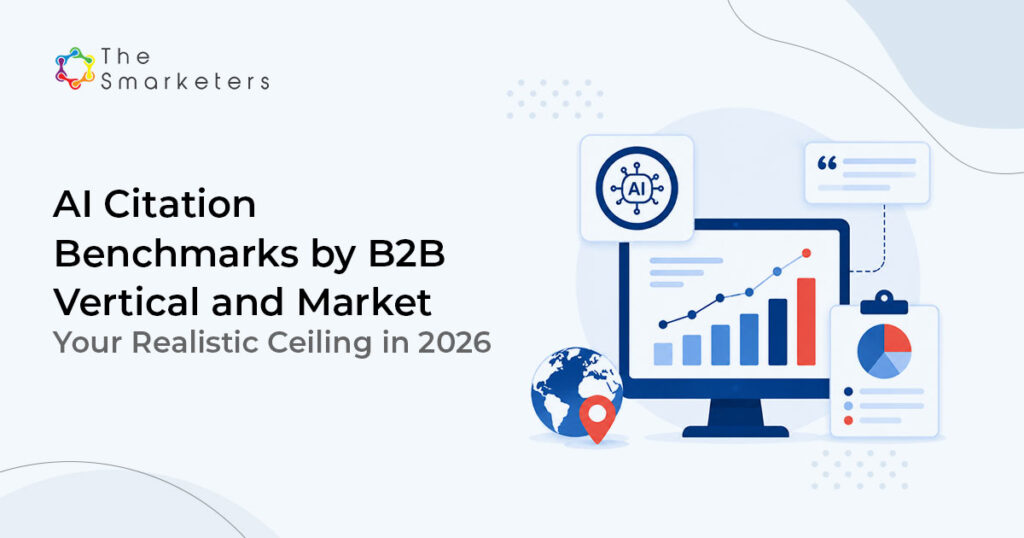
Every board asks the same question once AI visibility reaches a slide: what is good? These AI citation benchmarks answer that directly. The answer is lower than most people expect. Median B2B brands are cited in roughly 3% of relevant AI Overviews. Cybersecurity leads near 4.2%, while professional services and logistics sit near 2.1%. A realistic first-year target is doubling your vertical’s B2B AI Overview citation rate, not chasing parity with consumer brands.
Getting the ceiling wrong is expensive in a specific way. Teams set an impossible target, miss it, and the programme gets cut while it is working.
What Do AI Citation Benchmarks Actually Measure?
AI citation benchmarks measure how often enterprise B2B brands are cited in AI-generated answers for relevant queries – the 2026 data puts the median at 3% of AI Overviews, with the top quartile reaching 4.5%. The 3% figure specifically measures the share of relevant AI Overviews where a median enterprise B2B brand appears at all. Not first position, not preferred recommendation. Appears.
STAT
Median enterprise B2B brands rank for around 9,700 keywords but appear in just 3% of relevant AI Overviews. The top quartile reaches 4.5%, and 4.6% of enterprise B2B companies receive zero citations. Source: Walker Sands B2B AI Search Visibility Benchmark, 828 companies across 14 industries and 45 million queries, published June 2026.
Two details matter more than the headline. The gap between median and top quartile is 1.5 percentage points, so the leaders are not dramatically ahead; they are marginally ahead in a thin field. And 4.6% appear nowhere, a larger group than most competitive assumptions allow for.
In conventional organic search the leaders are often ten times the median. In AI citation benchmarks, they are roughly one and a half times, and the whole distribution sits low.
AI Citation Benchmarks by Vertical: Full Breakdown
he spread is narrow in absolute terms and wide in relative terms, which is why these percentages get misread in board packs.
| Vertical | AI Overview citation rate | Relative to the 3% median |
|---|---|---|
| Cybersecurity | 4.2% | 1.4x |
| B2B median, all verticals | 3.0% | Baseline |
| Top quartile, all verticals | 4.5% | 1.5x |
| Professional services | 2.1% | 0.7x |
| Logistics | 2.1% | 0.7x |
All figures from the Walker Sands B2B AI Search Visibility Benchmark, June 2026, covering 828 companies across 14 industries and 45 million queries.
When reading AI citation rate by industry data, focus on the right-hand column, not the left. A professional services firm reaching 3% has doubled its vertical median and beaten the all-industry median: a defensible result wearing an absolute number that sounds like failure.
Why Are Cybersecurity AI Citation Benchmarks Higher Than Professional Services?
Three structural differences, none of which is effort.
The first is source density. Cybersecurity has a dense ecosystem of independent publications, vulnerability databases, research blogs and practitioner communities. Since roughly 84% of AI citations come from earned and third-party sources, per research presented at MozCon in 2026, more independent sources means more citation supply.
The second is question shape. Security questions are closed and factual: does this tool detect this technique, is this standard required for this data type. Professional services questions are open: which firm suits our situation. Closed questions have extractable answers; open ones produce generic summaries naming nobody.
The third is publishing culture. Security vendors publish technical detail routinely, including research naming their own limitations. Professional services firms publish thought leadership that avoids specifics, which retrieves poorly.
KEY TAKEAWAY
Your vertical benchmark is mostly a function of how many independent sources exist in your category and how closed your buyers’ questions are. Both are structural, and neither is fixed by publishing more.
How Much Does Market Affect Your AI Citation Benchmarks?
More than vertical in some cases, and the published benchmark does not separate it. The Walker Sands study reports by industry rather than market, so anyone quoting a market-level citation rate is extrapolating.
What can be said is which mechanisms drive it. Answer engine rollout differs by market and language, so the denominator itself changes. Independent source density differs sharply: North America and Western Europe have deep trade press and review platform ecosystems, while several APAC markets and the Gulf have far fewer, capping citation supply regardless of effort. Language matters too, since a brand visible in one language can be absent in answers generated in another.
| Market condition | Effect on citation rate | Practical implication |
|---|---|---|
| Dense independent trade press | Raises supply | Outreach pays quickly |
| Few local review platforms | Caps the achievable rate | Target directories and analysts |
| Multiple buying languages | Splits visibility | Measure per language |
| Lower AI Overview incidence | Shrinks the denominator | Coverage flatters itself |
If you sell across markets, measure each separately. A blended number hides the market where you are winning and the one where you are absent. [FIELD: citation rate by market across our client base, once 12 months of tracked data exists]
VISUAL 1 · CAPTURE THIS
Two side-by-side screenshots of AI Overview results for the same B2B query issued in two language settings, source panels visible in both. Annotate the difference in cited domains.
How AI Overview Incidence Affects Citation Rate Measurement
This is the most misused number in the category. Citation rate is a fraction whose denominator is the count of queries where an AI answer appears at all. When incidence rises, your rate can fall while absolute citations increase.
STAT
AI Overviews drove 7.53% of organic sessions between September 2025 and June 2026, and 22.4% of that traffic was misattributed to Direct rather than Organic. Source: Search Engine Land analysis of 51,200 tracked events, August 2026.
Report both side by side: citation rate as the percentage, citation count as the absolute – our AEO measurement stack guide covers the exact tracking setup for both. A board shown only the percentage reads a rising denominator as a failing programme.
How do you set a target the board will accept?
Anchor to your vertical median, then commit to a multiple. The short version fits on one slide.
- State the published benchmark for your vertical and cite it, sample size included.
- Baseline your own rate against a fixed prompt set before any work starts.
- Commit to a multiple of your vertical median, not an absolute percentage. Doubling within twelve months is credible; four times is not.
We ran this with a technology client whose executive team had been told by a previous adviser to reach “50% AI visibility” – the same framing problem our B2B AEO strategy guide addresses at the programme level. We rebaselined against a fixed 300-prompt set, showed them the Walker Sands distribution, and reset the target to 2.5 times their starting coverage inside a year. The programme survived two budget reviews it would otherwise have failed.
PROOF POINT
Acuvate achieved a 292% increase in organic inbound leads. The reporting that protected that programme through review cycles was a fixed prompt set measured monthly, not a share-of-voice score that moved with every model update.
What Moves AI Citation Benchmarks? Four Levers Ranked by Effect
In descending order of effect.
Third-party source coverage. The largest lever by a wide margin, given roughly 84% of AI citations come from earned and third-party media according to MozCon research from 2026. Accurate records on sources already cited in your category beat more owned content – which is why our AEO and GEO services prioritise off-page citation building before owned content.
Question-shape alignment. Rewrite content to answer closed, factual questions rather than open ones. The cheapest lever available, and the one most teams skip.
Entity clarity. A consistent canonical description, resolved name collisions, Organization schema. Necessary, and it plateaus quickly.
Owned content depth. Real, and the slowest and weakest of the four. It matters most where no third-party ecosystem exists.
| Lever | Relative effect | Time to move | Typical cost |
|---|---|---|---|
| Third-party coverage | High | 6 to 16 weeks | Outreach time |
| Question-shape alignment | Medium to high | 4 to 8 weeks | Editing effort |
| Entity clarity | Medium, plateaus | 4 to 6 weeks | Low, one-off |
| Owned content depth | Low to medium | Two quarters+ | Highest |
Why You Must Rebaseline AI Citation Benchmarks Every Quarter
Because the denominator moves and the models change underneath you. Rebaselining means re-running the same fixed prompt set, recording rate and count, and noting any change in AI answer incidence for those prompts.
Keep the set frozen for at least four quarters. Changing prompts and celebrating an improved rate is the common self-deception here, and it is obvious to anyone who checks. Where prompts must be retired, report old and new sets in parallel for one quarter, which is the discipline we apply in answer engine and organic programmes.
When AI Citation Benchmarks Don’t Apply to Your Situation
The published data covers enterprise B2B companies across 14 industries. For a small company in a narrow category the median is not your comparison set, and a manually enumerated prompt set tells you more than any industry average.
Citation rate also says nothing about revenue. It measures presence in answers, not influence on decisions, and the link to the pipeline has to be built through discovery evidence and CRM tagging rather than assumed. We treat visibility metrics and pipeline measurement tools as separate reporting lines.
As a GEO benchmark, these 2026 figures reflect a fast-moving market. Only 15% of pages retrieved by ChatGPT appear in the final answer, Search Engine Land reported in March 2026, and retrieval and selection behaviour have both shifted repeatedly – which is why we track AI search visibility with a fixed prompt methodology rather than platform dashboards alone. Treat any benchmark older than two quarters as directional.
VISUAL 2 · CAPTURE THIS
Screenshot of a quarterly benchmark tracker in Google Sheets showing citation rate and count for one frozen prompt set across four quarters, with rate falling in a quarter while count rises. Annotate the divergence and the incidence column explaining it.
Frequently Asked Questions
What is a good AI citation rate for a B2B company?
Judge it against your vertical, not an absolute. The Walker Sands AI search visibility benchmarks, published in June 2026, put the median enterprise B2B brand at 3% of relevant AI Overviews and the top quartile at 4.5%. Cybersecurity reaches about 4.2%; professional services and logistics sit near 2.1%. Doubling your vertical median in a year is credible.
Why is the B2B AI Overview citation benchmark so low?
Because AI answers cite few sources per question and favour independent ones. Roughly 84% of citations come from earned and third-party media according to MozCon research from 2026, so vendor sites compete for a small remainder. The distribution is compressed too: the top quartile sits only 1.5 percentage points above the median.
How often are B2B brands cited by AI at all?
Less often than most teams assume, and some never. The Walker Sands study of 828 companies across 14 industries and 45 million queries, published June 2026, found 4.6% of enterprise B2B companies receive zero citations despite ranking for thousands of keywords. Conventional search performance does not carry over automatically.
Do AI citation rates differ by market?
The published benchmark reports by industry rather than market, so any market-level figure quoted elsewhere is an extrapolation. The mechanisms are clear enough: answer engine rollout differs by market and language, local independent source ecosystems differ in density, and multilingual buying splits visibility. Measure each market separately.
Should I report citation rate or citation count?
Both, side by side. Citation rate is a fraction whose denominator moves as AI answer incidence changes, so your rate can fall in a quarter when your absolute citations rise. Reporting the count alongside prevents a board from reading a growing answer surface as a failing programme. For a broader visibility metric that spans all AI platforms, see our guide to Share of LLM as a complementary B2B reporting standard.
How often should I rebaseline my AI visibility benchmark?
Quarterly, against a prompt set frozen for at least four quarters. Record rate, count and whether an AI answer appeared for each prompt. If prompts must be retired, run old and new sets in parallel for one quarter so the change is explainable rather than convenient.

Indrani Gope
Content Head