Table of Contents
- Why Traditional Marketing Metrics Fail CFO Budget Reviews
- What Does a CFO Want to See on a Marketing Dashboard?
- The Six Marketing Metrics CFOs Accept Instead of MQLs
- How to Read and Benchmark Each Marketing Metric for Finance Reviews
- What makes a number auditable?
- What narrative goes alongside the numbers?
- How to Build a CFO-Ready Marketing Dashboard in HubSpot
- Which MQL Metrics to Replace – and What Goes in Their Place
- Where this dashboard falls short
- Frequently Asked Questions
Need help with B2B Marketing?
Let the smarketers’ team drive your pipeline with data-led campaigns and AI-powered growth strategies.
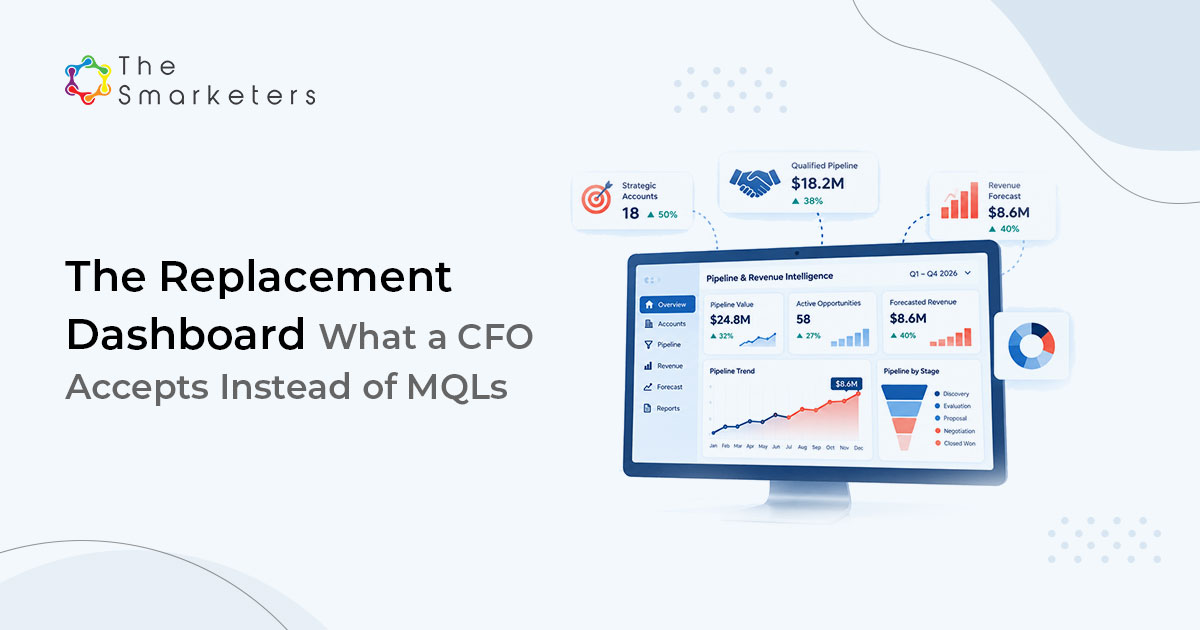
When a CFO questions the marketing numbers, they are rarely asking whether marketing works – they are asking whether the marketing metrics on the dashboard trace back to an auditable CRM record. A CFO will accept a marketing dashboard when every figure resolves to that standard, which means replacing volume counts with six metrics: pipeline coverage, pipeline velocity, buying-group coverage, influenced revenue, CAC payback and delivery capacity. Each needs a written formula and a named field source before it reaches finance.
We rebuilt reporting this way for a data platform client whose board pack still opened with a lead count. The first review after the change ran 20 minutes instead of an hour, because there was nothing left to argue about definitionally.
A CFO-ready marketing dashboard contains six metrics, each traceable to a named CRM field: pipeline coverage, pipeline velocity, buying-group coverage, influenced revenue, CAC payback, and delivery capacity coverage. Each requires a written formula and a version-controlled definition before it reaches a finance review.
Why Traditional Marketing Metrics Fail CFO Budget Reviews
Forrester found in 2026 that 8 of the top 12 criteria used to judge B2B marketing rely on engagement proof. That is the trap. Engagement proof is now the hardest thing to produce, because most research happens where no form is filled.
STAT
The average B2B buying decision now involves 13 internal stakeholders and 9 external influencers, and 67% of B2B buyers prefer a rep-free experience. Sources: Forrester, State of Business Buying, January 2026; Gartner, surveys of 645 to 646 B2B buyers, released March and May 2026.
A metric built on individuals raising their hands describes a shrinking fraction of the process. The MQL is not wrong so much as unrepresentative.
What Does a CFO Want to See on a Marketing Dashboard?
They are rarely asking whether marketing works. They are asking four narrower questions, and each has a test.
| The question behind it | What it tests | What satisfies it |
|---|---|---|
| Can I trace this to a record | Auditability | Click through to the deal list |
| Does it move before revenue | Leading value | Correlation with later stage movement |
| Has the definition changed | Comparability | Version-controlled definitions |
| What if we spend less | Elasticity | Scenario at two spend levels |
STAT
Marketing budgets sit at 7.8% of company revenue in 2026 and 56% of CMOs say their budget is insufficient to execute strategy. Source: Gartner 2026 CMO Spend Survey, 401 CMOs, released May 2026.
The Six Marketing Metrics CFOs Accept Instead of MQLs
Here is the set, with the formula and the fields each is calculated from. All six are computable from a standard CRM object model with no extra tooling.
| Metric | Definition | Formula | CRM field source |
|---|---|---|---|
| Pipeline coverage | Open pipeline against the target it must cover in the same period | Open pipeline value in period ÷ revenue target for period | Deal amount; deal stage; close date; pipeline; team target record |
| Pipeline velocity | Value the pipeline converts per day at current performance | (Qualified opportunities × average deal value × win rate) ÷ average cycle length in days | Deal amount; deal stage; create date; close date; stage timestamps |
| Buying-group coverage | Share of open deals with the required decision roles engaged recently | Deals with 4 or more labelled roles active in 90 days ÷ all open deals | Contact-to-deal association label; last activity date; contact job level |
| Influenced revenue | Closed-won value on deals that carried at least one marketing touch | Closed-won value with a qualifying touch in the lookback window ÷ total closed-won value | Deal amount; close date; activity type; first touch date; campaign association |
| CAC payback | Months of gross profit needed to repay the cost of winning a customer | Fully loaded acquisition cost per new customer ÷ monthly gross profit per customer | Deal amount; gross margin field; finance cost ledger mapped to period |
| Delivery capacity coverage | Whether the pipeline can be delivered if it all lands | Committed pipeline value for next two quarters ÷ deliverable capacity at target utilisation | Deal amount; expected start date; service line; resourcing plan |
Two notes. Buying-group coverage uses four roles as the threshold because that is where win rate separation becomes visible in the accounts we work on; set your own from your closed-won data. And delivery capacity coverage is the metric most marketing teams have never reported, which is why it earns attention in a finance review. The pipeline velocity formula – (qualified opportunities x average deal value x win rate) divided by average cycle length in days – is the metric that makes two programmes arithmetically comparable without a single assumption about attribution.
How to Read and Benchmark Each Marketing Metric for Finance Reviews
A formula without a threshold is decoration. Give every metric a range, a cadence and one owner.
| Metric | Healthy range | Cadence | Owner |
|---|---|---|---|
| Pipeline coverage | 3x to 5x, higher as cycle length rises | Monthly | RevOps |
| Pipeline velocity | Rising quarter on quarter | Quarterly | Sales leadership |
| Buying-group coverage | Above 60% of open deals | Monthly | Marketing and sales jointly |
| Influenced revenue | Reported, not targeted | Quarterly | Marketing |
| CAC payback | Under 18 months for enterprise deals | Quarterly | Finance |
| Delivery capacity coverage | 0.8 to 1.2 | Quarterly | Operations |
Influenced revenue deliberately has no target. Set one and teams begin manufacturing touches, at which point the number stops describing anything.
PROOF POINT
For a digital adoption platform client, replacing MQL metrics with a conversion chain – 112 MQLs, 20 SQLs, 5 closed deals – made the programme defensible at the deal level, not just the volume level. Stated that way, the programme could be judged on the conversion rates between each step rather than on the top figure alone.
What makes a number auditable?
A marketing metric is CFO-ready when a finance analyst can open one CRM record and reproduce the exact number on the dashboard. Three constraints follow.
Every metric must resolve to records, not a chart. If the dashboard says 62% buying-group coverage, clicking it should list the deals counted and those excluded. Every definition needs a version number and a change log, because a definition that quietly shifts between quarters destroys trust faster than a bad result. And the calculation lives in the CRM, not in a spreadsheet a marketing manager maintains.
KEY TAKEAWAY
The test is simple. Hand your dashboard to someone in finance with no marketing context and ask them to reproduce one number from the underlying records. If they cannot do it in ten minutes, it is not ready to present.
What narrative goes alongside the numbers?
Numbers without a story get interpreted by whoever speaks first. Write four short paragraphs each quarter and attach them.
- What moved and why, naming the programme or account activity behind it.
- What did not move, stated plainly, with the hypothesis for why.
- What changes next quarter as a result, and which of the six metrics it should affect.
- What we still cannot measure, and what that gap does to confidence in the rest.
Point four builds the credibility. Volunteering the limits of your own reporting makes the rest more believable, and stops finance finding the gap first.
How to Build a CFO-Ready Marketing Dashboard in HubSpot
A few weeks of build, not a permanent overhead, if the sequence is right.
- Agree definitions with finance in writing before touching the CRM. This is the longest step and the one most teams skip.
- Audit which fields exist and which need creating. Usually three or four are missing, most often expected start date and gross margin.
- Create association labels for buying-group roles and backfill them on open deals only, never on closed history.
- Build each metric as a calculated property with the formula documented in the field description.
- Generate the report automatically on the same day each month, with no manual assembly step.
- Version the definitions document and review it once a year, never mid-year.
Automation matters more than elegance. A dashboard an analyst has to assemble will drift, and the drift always favours whoever assembles it. Our RevOps team treats a manual step in a board report as a defect, and the pipeline velocity calculator is a quick way to sanity check the formula before building it.
For the full framework behind this build, including how RevOps connects marketing activity to closed revenue, see the B2B RevOps guide.
Which MQL Metrics to Replace – and What Goes in Their Place
Removing metrics is harder than adding them, because someone’s target depends on each. Do it in one move at the start of a year. Replace website sessions with pipeline coverage – the same metric central to a full-funnel B2B marketing model where one team is accountable for the number the CFO cares about.
| Stop reporting | Why | Report instead |
|---|---|---|
| MQL volume | Counts hand-raisers, not buying activity | Buying-group coverage |
| Cost per MQL | Optimises for the cheapest hand-raise | CAC payback |
| Website sessions | No link to pipeline in long cycles | Pipeline coverage |
| Email open rate | Unreliable since privacy protections became default | Multi-role engagement recency |
Where this dashboard falls short
It assumes deal data good enough to trust. If close dates are routinely pushed rather than reset, coverage and velocity both flatter you, and no reporting layer fixes a forecasting culture.
It suits an early-stage company badly. Below roughly 30 closed-won deals a year, win rate and cycle length are too volatile for velocity to mean much.
CAC payback depends on a cost allocation finance must own. Marketing calculating its own fully loaded cost is the fastest way to have it disputed.
None of the six measure brand or category demand, which in long-cycle categories is often where the real constraint sits.
Frequently Asked Questions
What marketing metrics should be reported to a CFO?
Six that trace to CRM records: pipeline coverage, pipeline velocity, buying-group coverage, influenced revenue, CAC payback and delivery capacity coverage. Each needs a written formula, a named field source and a version-controlled definition. Finance rejects numbers whose inputs cannot be inspected, not marketing measurement itself.
What should replace the MQL?
Buying-group coverage, measured as the share of open deals where four or more labelled decision roles have been active in the last 90 days. It captures the same intent signal the MQL was meant to represent, but at account level rather than individual level, which matches how B2B decisions are actually made.
How is buying-group coverage calculated?
Divide open deals with at least four labelled decision roles engaged in the last 90 days by all open deals. It needs contact-to-deal association labels and a last activity date on each contact. Set the role threshold from win rate separation in your own closed-won history.
Should influenced revenue have a target?
No. Report it, do not target it. Once a target exists, teams add touches to deals that were closing anyway and the number stops describing anything. Influenced revenue belongs on the dashboard as context for spend, not as a goal anyone is measured against.
How long does it take to build this dashboard?
A few weeks once definitions are agreed, and agreeing them with finance usually takes longer than the technical work. Most teams find three or four fields missing, typically expected start date and gross margin, and those must be populated before the first report is credible.
What is a good CAC payback period for enterprise B2B?
Under 18 months is a reasonable working threshold for enterprise deals, though the right figure depends on contract length and gross margin. Have finance own the cost allocation input. Marketing calculating its own fully loaded acquisition cost is the quickest route to having the whole number disputed.
What is buying-group coverage in B2B marketing?
Buying-group coverage is the share of open deals where four or more labelled decision roles have been active in the last 90 days. It replaces MQL volume as the account-level intent signal and is calculated from contact-to-deal association labels and last activity dates in the CRM. Set the role threshold from win rate separation in your own closed-won history.

Enoch Pakanati
CEO