Table of Contents
- Start With the Revenue Leakage Audit: Where You Are Losing Deals
- Tech Stack Consolidation: HubSpot as the Backbone
- Aligning Sales, Marketing, and CS on One Set of Metrics
- The 90-Day Implementation Timeline
- Case Study: A SaaS Funnel Rebuilt End to Front
- When a 90-Day RevOps Implementation Is the Wrong Move
- How The Smarketers Runs RevOps Implementations
- Frequently Asked Questions
Need help with B2B Marketing?
Let the smarketers’ team drive your pipeline with data-led campaigns and AI-powered growth strategies.
The board asks why pipeline coverage looks healthy but the quarter missed. Sales says marketing’s leads were junk. Marketing shows a dashboard where every target turns green. Customer success, who watched three renewals quietly churn, was not even in the meeting. Everyone has numbers; nobody has the same numbers.
That meeting is why RevOps exists. Revenue operations, one operating model for sales, marketing, and customer success on shared data and shared definitions, is no longer an experiment: roughly half of companies now run a dedicated RevOps function, up from 33% in 2020, and Gartner projected that 75% of the highest-growth companies would adopt a RevOps model by 2025. The payoff data is unusually consistent: companies with RevOps see 36% more revenue growth and up to 28% higher profitability, and public companies with dedicated RevOps posted 71% higher stock performance.
What most guides skip is the sequencing. RevOps implementations fail from doing the right things in the wrong order: buying tools before defining metrics, building dashboards before cleaning data. This blueprint lays out the 90-day sequence we run for B2B SaaS clients, phase by phase, including the audit that comes before anything gets configured.

Start With the Revenue Leakage Audit: Where You Are Losing Deals
Where do B2B SaaS companies lose revenue? Almost always at handoffs: between anonymous visit and known contact, between MQL and sales acceptance, between closed-won and onboarding, between success and renewal. The leakage audit walks every one of those seams with data before you change anything, because you cannot consolidate a system you have not mapped.
The benchmarks tell you where to look first. The median B2B conversion rate is 2.9% (Ruler Analytics, across 100M+ data points), and the average B2B website converts around 1.8%, with 3% good and 5%+ strong for higher-ACV businesses. Meanwhile up to 90% of identifiable account visitors stay anonymous through the journey, and only about 3% of web visitors ever fill a form. If your funnel math assumes form fills represent demand, the audit usually shows you are reading a tenth of the story.
The audit itself covers five seams, each with a concrete question:
- Visitor to contact: what share of target-account traffic ever becomes known, and what happens to the rest?
- Contact MQL to SQL: where do definitions differ between teams, and how many “MQLs” does sales silently ignore? Run your own numbers through an MQL-to-SQL conversion calculator and compare stages against benchmark.
- SQL to opportunity: how long does handoff take, and how many leads die waiting? Speed-to-follow-up is the most common single leak we find.
- Opportunity to close: which stages stall, and does anyone re-engage stalled deals systematically?
- Close to renewal: does CS see the promises sales made, and does marketing ever hear why customers churn?
Key stat: The average B2B cost per sales qualified lead is $1,357 (Starr Conspiracy, FY2024). Every SQL that leaks at a handoff is not a rounding error; it is four figures of acquisition spend written off silently. Source: thestarrconspiracy.com benchmarks.
Tech Stack Consolidation: HubSpot as the Backbone
The stack question in RevOps is not “which tools are best” but “which single system will every team trust as the source of truth.” For most B2B SaaS companies in the SMB and mid-market range, that answer is HubSpot, and the market has voted the same way: HubSpot ended 2025 with roughly 288,700 customers and $3.13B in revenue, up 19% year over year, and holds about 38% of the marketing automation market. Salesforce still leads overall CRM share at about 20.7% (IDC), but HubSpot is the fastest-growing major CRM by customer count and dominant in SMB and mid-market, which is exactly the segment this blueprint serves.
Consolidation is where CRM sprawl gets unwound. With CRM adoption growing about 12.6% year over year, most scale-ups have accumulated overlapping tools: a CRM, a marketing automation platform, a separate CS tool, two enrichment vendors, and spreadsheets stitching them together. Every integration seam is a place where data quietly diverges, and diverging data is where the Monday-meeting argument starts.
The consolidation rules we apply:
- One object model. Contacts, companies, deals, and tickets live in HubSpot; every other tool reads from it or writes to it through governed sync, never a second master copy.
- Migrate with hygiene rules, not as-is. Importing a dirty CRM into a clean one just relocates the problem. Dedupe, standardize fields, and archive dead records at migration time; it is the cheapest moment you will ever have to do it.
- Kill tools by decision, not neglect. Each retired tool needs an owner, an end date, and a data destination. “We still pay for it but nobody uses it” is a RevOps smell.
- Buy the gap, not the roadmap. Add point tools only where HubSpot demonstrably cannot do the job today, and re-evaluate yearly; the platform ships fast enough that last year’s gap is often closed.
Aligning Sales, Marketing, and CS on One Set of Metrics
Alignment is not a workshop; it is a signed agreement about numbers. We call it the metric contract: one lifecycle model, one definition per stage, one owner per metric, written down and enforced by the CRM rather than by goodwill. When the median buying group is 11.2 people for deals over $50K, account-level metrics have to replace contact-level vanity counts, or marketing gets credit for touching one person while sales works the other ten.
The shared scoreboard we implement for B2B SaaS teams:
| Metric | Replaces | Why it aligns teams |
|---|---|---|
| Pipeline velocity (opportunities × win rate × deal size ÷ cycle length) | MQL volume | Every team can move one of its four inputs; nobody can game it with volume alone. |
| Buying-group engagement per target account | Contact-level lead scores | Matches how enterprise deals are actually decided (11.2-person median group). |
| Stage-to-stage conversion with agreed definitions | Each team's private funnel | Makes leaks visible at the seam where they happen, not in the quarterly post-mortem. |
| CAC and cost per SQL against the $1,357 benchmark | Cost per lead | Prices the leaks; connects marketing spend to what sales actually accepts. |
| Net revenue retention | Renewal rate reported by CS alone | Forces marketing and sales to care about the promises the customer bought. |
Smarketers insight: The metric contract works only if leadership publicly retires the old metrics. If the CEO still asks “how many MQLs this month” in the all-hands, the org will keep optimizing MQLs no matter what the dashboard says. Rewire the questions leaders ask, and the teams follow within a quarter.
The 90-Day Implementation Timeline
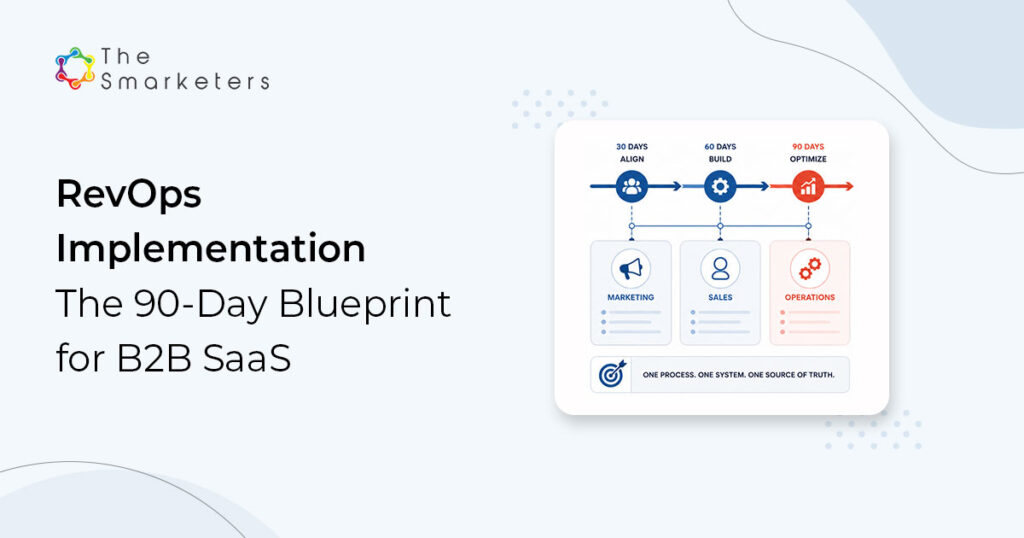
How long does RevOps implementation take? Ninety days to a functioning operating model, if you sequence it correctly: audit and definitions in the first month, systems in the second, dashboards and cadence in the third. Anything promised faster usually means someone skipped the audit; anything much slower usually means the scope crept into a multi-year replatforming. This is the sequence we run, packaged as the 30-60-90 RevOps Blueprint:
- Days 1-15: Revenue leakage audit. Map the five seams, pull 12 months of funnel data, interview each team about where deals die. Output: a ranked leak list with revenue estimates attached.
- Days 16-30: The metric contract. One lifecycle model, stage definitions signed by sales, marketing, and CS leadership, metric owners named. Output: a one-page contract the CRM will enforce.
- Days 31-45: Stack consolidation. HubSpot confirmed as the object-model backbone, migration with hygiene rules, retirement dates for overlapping tools. Output: one source of truth with governed integrations.
- Days 46-60: Lifecycle and routing rebuild. Stages, scoring, routing, and SLAs configured to the contract; speed-to-follow-up automated. Output: every record moves by the same rules in every team.
- Days 61-75: Dashboards and forecasting. The shared scoreboard goes live: velocity, stage conversion, CAC, buying-group engagement, forecast accuracy tracking. Output: one dashboard all three teams present from.
- Days 76-90: Operating cadence. Weekly revenue review across the three teams, monthly leak re-audit, quarterly target and definition reset. Output: RevOps as a rhythm, not a completed project.

Two staffing notes from experience. First, name a single accountable owner for the 90 days, even if RevOps is not yet a full-time role; committee-run implementations stall at the definitions phase. Second, budget real time from one admin-level HubSpot operator, roughly half-time across the middle month, or the configuration work queues behind day jobs and the timeline doubles.
What good looks like at day 90
A passing implementation is easy to test. Ask five questions and require yes to all of them:
- Can sales, marketing, and CS leadership open the same dashboard in a revenue meeting and argue about decisions instead of data?
- Does every stage in the funnel have one written definition, one owner, and a conversion rate someone is accountable for?
- Does a new inbound lead route to an owner, with an SLA clock running, without a human touching a spreadsheet?
- Can you produce this quarter’s pipeline velocity number, with its four inputs, in under five minutes?
- Has at least one leak from the day-1 audit measurably narrowed, with the before and after on record?
Teams that pass four of five are in good shape; the fifth is the next quarter’s work. Teams that pass one or two did a tooling project, not a RevOps implementation, and the Monday argument will be back within two quarters.
Case Study: A SaaS Funnel Rebuilt End to Front
A digital adoption platform (B2B SaaS) came to us with the classic pre-RevOps profile: respectable traffic, a lead number nobody trusted, and a sales team that treated marketing leads as a courtesy queue. Definitions differed between teams, and reporting lived in three tools that disagreed.
We ran this blueprint: leakage audit first, then a metric contract, then consolidation onto HubSpot with rebuilt lifecycle stages and routing, then a single shared dashboard. Content and campaigns continued throughout; what changed was the system underneath them.
Result: The rebuilt funnel produced 112 marketing qualified leads, 20 sales qualified leads accepted by sales, and 5 closed deals, with every stage visible to every team for the first time. (Smarketers client engagement; conservative figures; full story at thesmarketers.com/success-stories/)

The honest read of those numbers: the volume is modest, and that is the point. Before the rebuild, the company reported a larger lead number that produced almost nothing sales. Fewer, real, accepted leads with visible conversion beat inflated counts every quarter, and the shared visibility is what lets the team scale the working stages afterward.
When a 90-Day RevOps Implementation Is the Wrong Move
- Below roughly 15 to 20 revenue-facing people. You do not need an operating model to align three people; you need a shared spreadsheet and a weekly conversation. Adopt the metric definitions, skip the program.
- Mid-quarter fire drills. If the company misses payroll without this quarter’s number, do not rebuild the machine while it is running a sprint. Fix the single worst leak from a mini-audit and schedule the full program for quarter start.
- During a CRM contract you cannot exit. If you are locked into a competing platform for two more years, run the audit and the metric contract now (they are platform-neutral) and defer consolidation to the renewal window.
- If leadership will not retire old metrics. This is the honest deal-breaker. When executives insist on keeping every legacy KPI alongside the new scoreboard, the implementation produces a second reporting layer instead of alignment, and you will have paid for more confusion.
How The Smarketers Runs RevOps Implementations
We are a HubSpot Platinum Solutions Partner, and our RevOps work runs on the blueprint above: audit before configuration, definitions before dashboards, one source of truth before any automation. Implementation covers HubSpot architecture and migration, lifecycle and routing build, the shared scoreboard, and the operating cadence, with demand generation programs that plug into the same system rather than reporting beside it. You can pressure-test your own numbers first with our free pipeline velocity and MQL-to-SQL calculators.
If the Monday-meeting argument sounds familiar, book a RevOps assessment. It is the leakage audit from days 1 to 15 of this blueprint, run against your actual funnel data, and it tells you what the 90 days would fix before you commit to them.
Frequently Asked Questions
What does a RevOps implementation cost for a B2B SaaS company?
Budget three components: platform licenses (HubSpot Professional or Enterprise hubs), implementation effort (agency or internal, typically the equivalent of one to two people for the 90 days), and ongoing operation (a half-time to full-time RevOps operator after go-live). Mid-market implementations commonly land in the $30K-$80K range for the build, though scope drives wide variance; the leakage audit prices the specific case.
Do we need to hire a RevOps leader before starting?
No, but you need a named accountable owner for the 90 days, which can be an existing ops-minded leader. Hiring works better after the audit, because the leak list tells you whether you need a systems-heavy operator, an analytics-heavy one, or a process leader.
Can we run this blueprint on Salesforce instead of HubSpot?
The sequence is platform-neutral: audit, metric contract, consolidation, rebuild, dashboards, cadence all apply. We default to HubSpot for SMB and mid-market SaaS because consolidation is simpler on a single-platform suite; Salesforce-centered stacks usually take longer in the consolidation phase because more integrations must be governed.
What data do we need ready before day 1?
Twelve months of funnel data (traffic, conversions, stage movement, win/loss), CRM admin access, a list of every revenue-facing tool with owners and costs, and 45 minutes each with sales, marketing, and CS leadership. Imperfect data is expected; discovering how imperfect it is belongs to the audit.
Which KPI should we watch first to know it is working?
Speed-to-follow-up and MQL-to-SQL acceptance rate move first, usually within the first month after routing goes live. Pipeline velocity is the headline metric but needs a full cycle or two of data before the trend is trustworthy. Treat forecast accuracy as the 6-month verdict.
How does RevOps change what marketing reports?
Marketing stops reporting lead volume as the headline and starts reporting buying-group engagement in target accounts, stage conversion on sourced pipeline, and cost per accepted SQL against the $1,357 B2B benchmark. It is a harder scoreboard, and it is the one sales already believes.
What breaks most often after go-live?
Definition drift. New hires invent stage interpretations, a team quietly adds a side spreadsheet, and six months later the numbers argue again. The monthly leak re-audit and quarterly definition reset in the operating cadence exist specifically to catch drift early.
Is 90 days realistic if our CRM data is a mess?
Yes, if you resist the urge to clean everything. The blueprint cleans what the metric contract needs (active pipeline, target accounts, last 12 months) and archives the rest. Full historical cleanup is a separate, lower-priority project; blocking go-live on it is how 90-day plans become 9-month plans.

Enoch Pakanati
CEO