Table of Contents
- Why Traditional Marketing Metrics Fail for ABM (and What to Use Instead)
- The 4-Tier ABM Measurement Model
- Account-Level vs Lead-Level Metrics: What Changes in Practice
- Reporting ABM to the C-Suite
- How The Smarketers Builds and Deploys an ABM Measurement Framework
- When a Full ABM Measurement Framework Is Not the Right Fit: 4 Exceptions
- How to Start Building Your ABM Measurement Framework: A One-Hour Audit
- Frequently Asked Questions
Need help with B2B Marketing?
Let the smarketers’ team drive your pipeline with data-led campaigns and AI-powered growth strategies.
Eight months into an ABM program run without a structured ABM measurement framework, the CFO asks a fair question: what did we get for the money? The ABM lead opens a dashboard full of account engagement scores, ad impressions on target accounts, and intent spikes. The CFO sees none of the three words she cares about: pipeline, revenue, retention. Budget season arrives, and the program that was working gets cut anyway, because nobody could prove it was working.
This failure is common enough to be measurable. ITSMA found that only 52% of companies measure ABM ROI at all, and the top-performing programs are 30% more likely to measure than the rest. The 2025 ABM Benchmark Survey from Demand Gen Report puts proving ROI among the top challenges for 47% of ABM practitioners – a problem our ABM ROI calculator is built to solve before the first campaign ships. The irony is sharp, because the same research base says ABM outperforms: 87% of marketers report ABM delivers higher ROI than other strategies. The results exist. The measurement usually does not.
This article lays out the 4-Tier ABM measurement framework we use at The Smarketers to close that gap – the same approach that underpins our Account-Based Marketing services.

Why Traditional Marketing Metrics Fail for ABM (and What to Use Instead)
Traditional metrics fail because they count the wrong unit. Lead-based reporting treats every form-fill as an equal event, but ABM concentrates effort on a defined list of accounts where the buying unit is a committee, not a person. Forrester and 6sense put the median B2B buying group at 11.2 people for deals over $50K. Lead metrics would score eleven stakeholders from one target account as eleven unrelated records, and a single junior download from a non-target account as their equal. Both readings are wrong, and both distort budget decisions.
The second failure is timing. 70 to 80% of the buyer journey happens before first vendor contact, and up to 90% of identifiable account visitors remain anonymous through the journey. MQL counting starts the clock at the form-fill, which means it misses most of the influence ABM actually exerts: the months of account warming that happen before anyone raises a hand. A measurement model that cannot see pre-form engagement will always conclude that ABM “did nothing,” right up until the deal appears fully formed.
Third, lead metrics cannot express the outcomes ABM is bought for. Forrester’s regional ROI research found ABM ROI most commonly lands 21 to 50% higher than other marketing, with 23% of respondents reporting 51 to 200% higher, and ITSMA-tracked programs report a 48% increase in revenue per account. Revenue per account, deal size, velocity, expansion: none of these appears on an MQL dashboard. If the metric system cannot represent the promise, it cannot verify it either.
Key stat: Companies using ABM report a 48% increase in revenue per account, and 45% of B2B marketers using ABM report revenue up 10%+ within 12 months. Both numbers are only visible in account-level reporting; neither exists on a lead-based dashboard. (Sources: ITSMA via G2; Forrester.)
The 4-Tier ABM Measurement Model
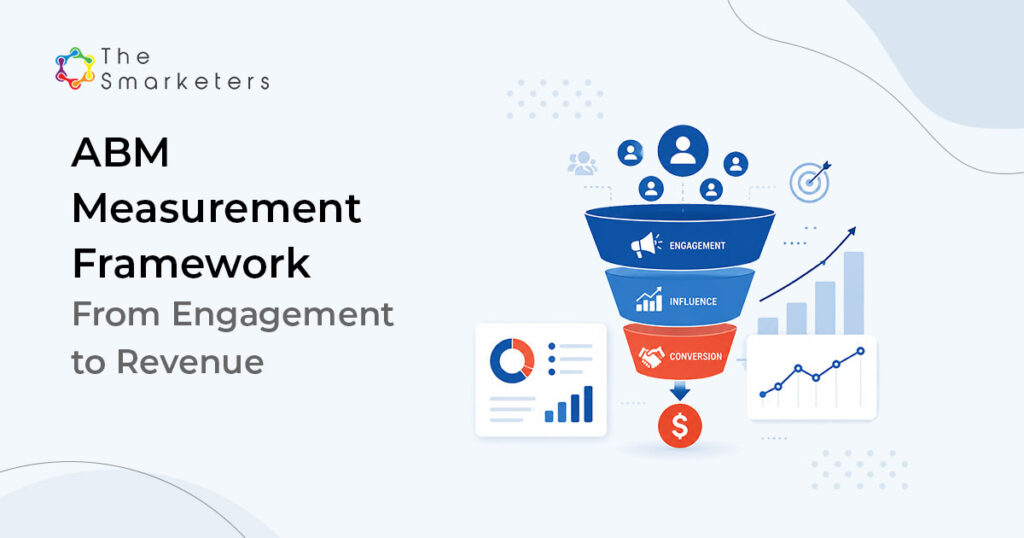
How do you measure ABM? Measure it in four tiers that mirror how account revenue actually forms: Engagement, then Pipeline, then Revenue, then Expansion. Each tier answers one question, leads the next, and reports to a different audience. Early tiers move weekly and guide the team; later tiers move quarterly and justify the budget. Programs get into trouble when they report only tier 1 (activity without money) or only tier 3 (money without explanation).
- Tier 1: Engagement. Are the right people at target accounts spending real time with us? Track engaged-account rate (share of the target list showing meaningful activity), buying-committee coverage (how many of the roles you need are engaged, against that 11.2-person benchmark), and engagement depth per account. Audience: the ABM team, weekly.
- Tier 2: Pipeline. Are engaged accounts becoming qualified opportunities? The ABM pipeline metrics to track at this tier are: target-account opportunity rate, pipeline value created from the list, and account velocity – the days elapsed from first engagement to opportunity creation. Audience: marketing and sales leadership, monthly.
- Tier 3: Revenue. Are ABM accounts closing bigger, faster, and more often? Track win rate, average deal size, and cycle length for ABM accounts against a comparable non-ABM control group, plus revenue per account. Audience: CMO and CFO, quarterly.
- Tier 4: Expansion. Do won accounts stay and grow? Track net revenue retention on ABM-sourced accounts – this is the tier where net revenue retention from ABM-sourced accounts compounds, and where most programs leave the most value unmeasured, (revenue kept plus expansion, minus churn), renewal rate, and expansion pipeline. This is where the 48% revenue-per-account effect compounds. Audience: executive team, quarterly and annually.

Two disciplines make the model honest. First, define “engaged” numerically before launch (for example: three or more meaningful touches across two or more committee members within 30 days), or tier 1 becomes a vanity number. Second, build the control group on day one. Without a comparison set of similar non-ABM accounts, every tier-3 claim is an assertion, and CFOs are professionally trained to ignore assertions.
The model at a glance
An ABM measurement framework organises performance tracking across four tiers: Engagement (leading indicators), Pipeline (opportunity creation), Revenue (deal outcomes), and Expansion (retention and growth). Each tier has a defined owner, a reporting cadence, and metrics that answer a distinct business question.
| Tier | Core metrics | Cadence | Primary audience |
|---|---|---|---|
| 1. Engagement | Engaged-account rate, committee coverage, engagement depth per account. | Weekly | ABM team |
| 2. Pipeline | Target-account opportunity rate, pipeline value from list, account velocity. | Monthly | Marketing + Sales leadership |
| 3. Revenue | Win rate, deal size, cycle length vs control, revenue per account. | Quarterly | CMO + CFO |
| 4. Expansion | Net revenue retention, renewal rate, expansion pipeline. | Quarterly / Annual | Executive team |
Treat the table as a contract, not a suggestion. Each cell has an owner who is named in the measurement charter, and each metric has a written definition that survives personnel changes. The cadence column matters more than teams expect: reviewing tier-1 numbers quarterly is too slow to steer campaigns, and dragging executives through weekly engagement scores is how ABM reporting loses the room. Match the rhythm of each tier to the decisions it feeds, and the same model serves both the practitioners running plays and the leadership deciding whether to fund more of them.
Account-Level vs Lead-Level Metrics: What Changes in Practice
The shift from lead-level to account-level metrics is not cosmetic relabeling; nearly every number on the dashboard changes its unit, its source, and its meaning:
| Question | Lead-level habit | Account-level replacement |
|---|---|---|
| Is marketing working? | MQL volume this month. | Engaged-account rate on the target list. |
| Is sales getting quality? | MQL-to-SQL conversion. | Committee coverage per opportunity account. |
| What did it cost? | Cost per lead. | Cost per engaged account; cost per opportunity account. |
| What did it earn? | Revenue attributed to last-touch campaigns. | Revenue per account vs. control group; ABM-influenced pipeline. |
| Is it durable? | Rarely asked. | Net revenue retention and expansion on ABM accounts. |
One practical warning from client work: do not delete lead metrics on day one. Form-fills and MQLs still matter operationally for routing and follow-up speed. The change is hierarchical, account metrics become the language of performance while lead metrics become internal plumbing. Teams that frame it this way get sales cooperation; teams that announce “MQLs are dead” spend a quarter arguing about definitions instead of measuring.
Smarketers insight: The single highest-value metric to add first is committee coverage: how many of the 5 to 7 roles that typically decide your deals are engaged at each opportunity account. It predicts win rate movement earlier than any pipeline number we track, and it tells sales exactly whom to go get.
Reporting ABM to the C-Suite
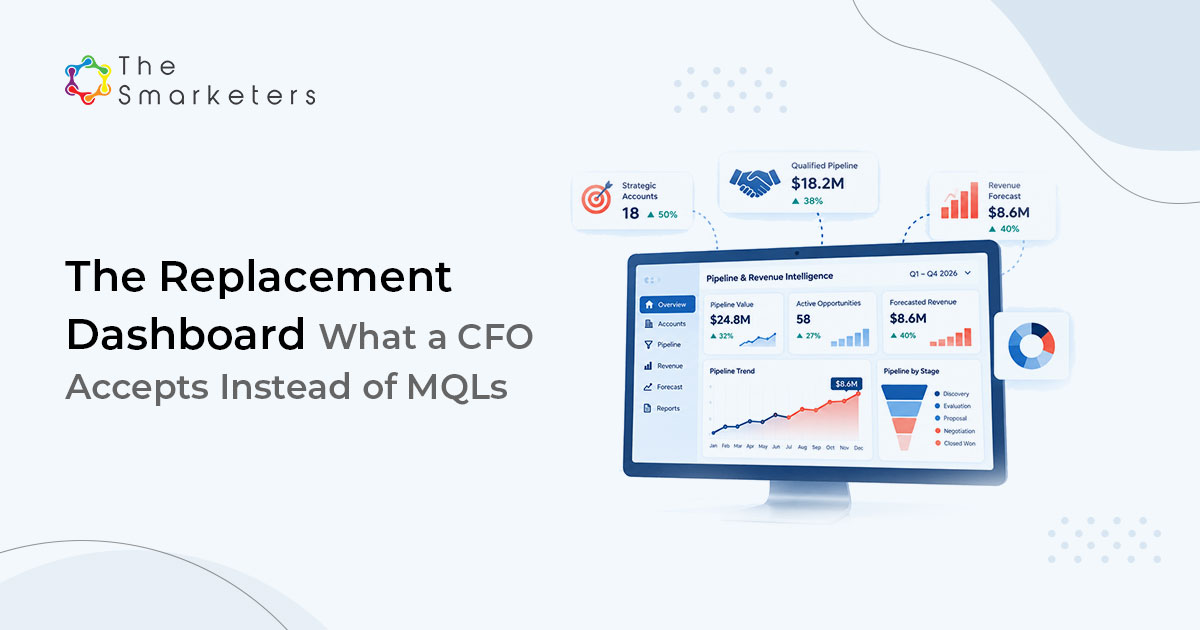
Executives fund outcomes, so the report leads with tier 3 and works backward. A structure that survives CFO scrutiny fits on one page: revenue and pipeline from target accounts against the control group first, the trend over time second, the tier-1 and tier-2 movement that explains next quarter third, and asks last. Everything else is appendix.
Frame the numbers against external benchmarks so leadership can judge whether the program is normal, ahead, or behind. Forrester’s finding that 45% of B2B marketers using ABM report revenue up 10%+ within 12 months is a useful calibration: it tells your board that meaningful revenue movement inside a year is common but not guaranteed, which sets expectations a young program can actually meet. Numbers also need denominators: “12 opportunity accounts” means little; “12 of 60 target accounts reached opportunity, against 4 of 60 in the control group” is a decision-grade sentence.
And be candid about attribution. ABM influence is multi-touch and partly invisible, so present a range (ABM-sourced revenue as the floor, ABM-influenced as the ceiling) rather than one falsely precise number. In our experience a CFO trusts a disciplined range far more than a suspiciously exact ROI figure, because the range shows you understand what the data can and cannot prove.
One more habit separates reports that get renewed budgets from reports that get polite nods: narrate the tier connections. “Committee coverage at our top 20 accounts doubled last quarter, which is why opportunity creation is accelerating this quarter, which is why we forecast these three accounts closing next quarter” is a causal story an executive can retell in a board meeting. Disconnected tiles on a dashboard are not. The model gives you the tiers; the report has to supply the arrows between them.
How The Smarketers Builds and Deploys an ABM Measurement Framework
We instrument the 4-Tier Model before a program’s first campaign ships, not after its first budget review. Across 40+ ABM programs with an 85% success rate, the pattern is consistent: programs that define engagement thresholds, control groups, and tier owners in week one defend their budgets; programs that retrofit measurement in month eight fight for survival with anecdotes. Practically, that means a measurement charter (definitions and owners per tier), CRM instrumentation so account-level rollups exist natively, a control group frozen at launch, and a one-page executive report template agreed with finance before the first number is ever shown.
Case study: measurement that survived the CFO
A Fortune 500 industrial automation manufacturer engaged us to run an ABM pilot with exactly this instrumentation. Because tiers and baselines were defined up front, the results were legible to finance without translation: 300+ sales opportunities in four weeks, with cost per lead cut by 90% against the pre-program baseline (Smarketers client engagement). The 90% CPL reduction mattered less for its size than for its provability: same offer economics, same market, measured before and after, which is what made the expansion budget an easy yes.

Key takeaway: The measurement system was built before the campaign, so the result needed no debate afterward. If you remember one thing from this article: instrument first, launch second.
When a Full ABM Measurement Framework Is Not the Right Fit: 4 Exceptions
Full four-tier instrumentation is overkill in some situations, and pretending otherwise wastes quarters:
- Pilot programs under roughly 25 accounts. The sample is too small for control-group statistics to mean anything. Measure tier 1 and tier 2 honestly, treat tier 3 as case-by-case deal stories, and defer the full model until the list grows.
- Sales cycles longer than your reporting patience. If deals take 18 months, tier 3 will be empty for 18 months no matter how good the program is. Agree with leadership in advance which leading indicators stand in for revenue, or the program dies of impatience before the data arrives.
- CRM hygiene is not there yet. Account hierarchies, contact-to-account association, and opportunity discipline are prerequisites. Rolling up bad data to account level produces confident nonsense; fix the plumbing first.
- ABM is not really the motion. If your ACV is low and your market is broad, volume inbound with standard funnel metrics may genuinely fit better. An honest measurement conversation sometimes concludes the program, not the dashboard, is the problem.
How to Start Building Your ABM Measurement Framework: A One-Hour Audit
Run a one-hour audit this week using your ABM measurement framework as the guide: for each of the four tiers, write down the metric you currently report, its owner, and its data source. Most teams find tier 1 crowded, tier 3 empty, and tier 4 unclaimed, and that map is your roadmap. To pressure-test the revenue math, model your program in our ABM ROI calculator, and if you want a complete resource on how to measure ABM ROI – including definitions, dashboard templates, and the C-suite report format – download the ABM Measurement Guide. It is the same charter we use to instrument client programs in week one.
Frequently Asked Questions
How long before an ABM program shows measurable revenue results?
Tier 1 engagement moves within 4 to 8 weeks, pipeline within one to two quarters, and revenue on the timeline of your sales cycle plus a quarter. Forrester found 45% of ABM users report revenue up 10%+ within 12 months, which is a realistic calibration for leadership expectations.
What tools do we need to run the 4-tier model?
A CRM with clean account hierarchies is the non-negotiable core, plus your marketing automation platform for engagement rollups. Platforms like HubSpot cover tiers 1 through 3 natively for most mid-market programs; dedicated ABM platforms add anonymous-account visibility and intent data as the program scales.
How do we build a credible control group?
At launch, set aside a segment of accounts with similar firmographics, intent levels, and territory coverage that will not receive ABM treatment, and freeze the list. Even 20 to 30 control accounts turn your revenue claims from assertions into comparisons.
What is a good engaged-account rate on a target list?
It depends on list quality and program maturity, so benchmark against your own baseline first: measure the rate in month one, then track the trend. Programs typically aim to have a clear majority of tier-1 accounts showing meaningful multi-person engagement within two quarters.
How should we attribute revenue when ABM and other channels both touched the account?
Report a range: ABM-sourced revenue (opportunities created from target-account engagement) as the floor, ABM-influenced revenue (closed accounts that received meaningful ABM touches) as the ceiling. Present both to finance and resist collapsing them into one number.
What budget share should measurement infrastructure get?
A working rule from our engagements: plan roughly a tenth of program budget for measurement setup in year one, covering CRM instrumentation, dashboard build, and definitions work. It is the least glamorous line item and the one that decides whether year two gets funded.
Which single metric matters most if we can only fix one?
Buying committee coverage – how many of the buying roles that decide your deals are actively engaged per opportunity account – leads to win rate, exposes single-threaded deals early, and gives sales an immediate action per account. It leads win rate, exposes single-threaded deals early, and gives sales an immediate action per account.
Does this framework work for one-person ABM teams?
Yes, in a reduced form. Track engaged-account rate, target-account pipeline, and won revenue against last year’s comparable accounts, skipping formal control groups and tier-4 dashboards until headcount grows. The principle, accounts as the unit and revenue as the endpoint, scales down; the tooling ambition should too.

Siddharth Rampelli
Senior Growth Marketing Manager