Table of Contents
- Why Most SaaS Websites Fail at Conversion
- The Conversion-First Architecture
- AEO-Optimized Page Structure: Your Next Redesign Has Two Audiences
- HubSpot CMS vs Headless: Choose for the Team You Have
- Measuring Website ROI: Prove the Redesign Paid for Itself
- What Conversion-First Looks Like in Results
- When a Full Redesign Is the Wrong Move
- Smarketers Web Development Services
- Frequently Asked Questions
Need help with B2B Marketing?
Let the smarketers’ team drive your pipeline with data-led campaigns and AI-powered growth strategies.
Here is the redesign story nobody puts in the case study: a SaaS company spends two quarters and a serious budget on a new website. The launch went well. The site is faster, the brand looks sharper, the team is proud. Ninety days later someone checks the number that was supposed to move. Demo requests per thousand visitors: unchanged. The company bought a repaint and called it a renovation.
The benchmark data explains why this is the default outcome. The average B2B website converts around 1.8% of visitors, with 3% considered good and 5%+ strong for higher-ACV companies. The median across industries sits at 2.9%, based on Ruler Analytics data covering more than 100 million data points. SaaS specifically spans 1.1% to 7% depending on ACV and sales motion. That spread is the entire argument of this article: within one industry, the best sites convert several times more of the same traffic than the average ones. A redesign is the rare moment when you get to rebuild the machinery behind that number. Most teams spend the moment on aesthetics.
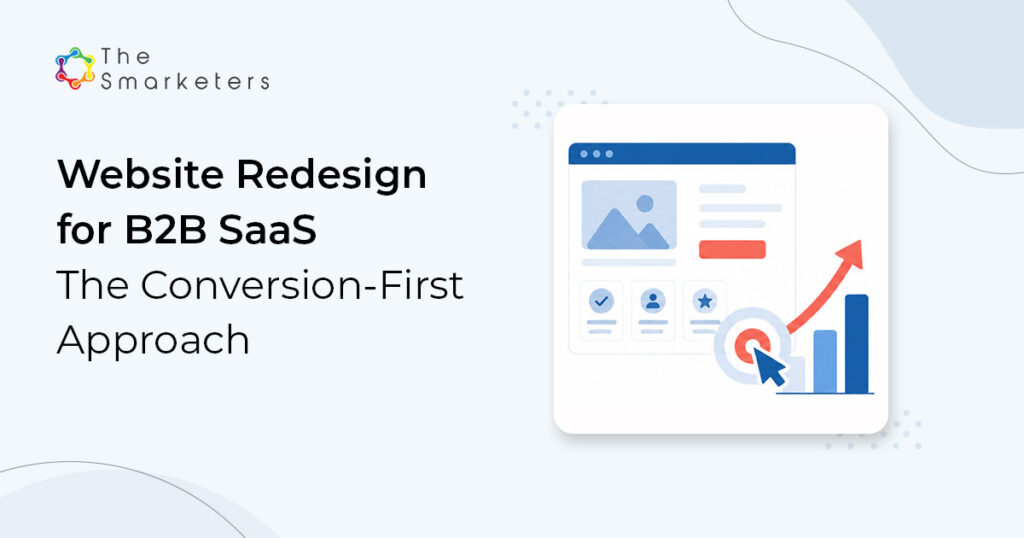
A conversion-first redesign inverts the brief. Instead of “make the site look like who we are now,” the brief becomes “make the site produce more pipeline per visitor, and look great doing it.” This article covers the approach we use: why SaaS sites underconvert, the conversion-first architecture, AEO-ready page structure, the CMS decision, and how to measure the ROI honestly.
Why Most SaaS Websites Fail at Conversion
The short answer: most SaaS websites are written for the company, structured for the org chart, and rebuilt for the brand, while the buyer arrives with a question, a comparison, and about eight seconds of patience. The specific failure modes are consistent enough to list:
- The homepage carries jobs the whole site should share. Positioning, proof, product tour, pricing signal, and three audiences’ messaging compete for one viewport, so no single visitor feels addressed.
- Category jargon replaces the buyer’s words. Sites describe “unified intelligent platforms” while buyers search for the problem they have. If a first-time visitor cannot say what you do in one sentence, neither can an AI assistant summarize you.
- Proof is quarantined. Case studies live in a resources graveyard instead of sitting next to the claims they support, where decisions actually happen.
- Forms ask for more than the offer is worth. Seven fields for a “quick demo” is a price tag; only around 3% of web visitors convert to form-fills even in well-run programs, and overpriced forms push that lower.
- Speed is treated as an IT concern. Performance studies show a 1-second delay in load time can cut conversions by roughly 7%, and each extra second between 0 and 5 seconds drops conversion by about 4.42% on average. Meanwhile 47% of users expect pages to load in 2 seconds or less. Every animation-heavy redesign that ignores this trades measurable revenue for polish.

There is also a buyer-expectation shift underneath these mechanics. Forrester research indicates 70 to 80% of the buyer journey happens before first vendor contact, which means the website is not a brochure supporting your sales team. For most of the journey, it is the sales team. A SaaS site that hides pricing signals, gates every useful asset, and funnels every question toward “book a demo” is asking self-directed buyers to behave like it is 2015. They will not. They will simply finish their evaluation somewhere that lets them.
Underneath all five failure modes is one structural cause: redesigns are usually scoped as design projects with a content deadline, rather than as revenue projects with a design phase. The fix is not to taste better. It is a different sequence, which is what the conversion-first architecture provides.
The Conversion-First Architecture
A conversion-first redesign is one where every page, template, and form is designed backward from a pipeline outcome before any visual design begins. We run it as a six-stage sequence we call the Conversion-First Redesign Loop, and the order is the method: strategy decisions flow downhill into design, never the reverse.

- Revenue teardown. Before touching anything, map which pages and journeys produce pipeline today: entry pages of closed-won deals, drop-off points on demo paths, which CTAs actually get clicked on. This protects what works (redesigns routinely destroy their own best-performing pages) and locates the leaks worth fixing.
- Message architecture. Assign every key page one visitor question and one job. Homepage: “am I in the right place?” Product pages: “will this solve my problem?” Pricing: “can I afford to shortlist this?” Write the answers in buyer language, attach proof to every claim, and only then hand the content to design.
- Conversion wireframes. Design the decision path before the visual system: where proof sits relative to claims, how many clicks from any page to a conversion action, what each form asks versus what the offer is worth. Include a lower-commitment action on every high-intent page, because most visitors are not demo-ready.
- AEO-ready structure. Build pages machines can quote, covered in the next section.
- Performance build. Set speed budgets per template before development starts, enforce them in staging, and design mobile-first. Desktop converts around 4.8% versus roughly 2.9% on mobile, per grow-conversions benchmarks, which means mobile experience is where the most recoverable conversion is hiding.
- Measure and iterate. Launch is the midpoint. Instrument every step of every conversion path and treat the first 90 days post-launch as the most valuable CRO window you will ever get, because everything is newly measurable.
Two governance rules keep the loop honest. First, give the project a revenue owner, not just a design owner: someone whose success is measured in pipeline per visitor and who can veto beautiful ideas that add friction. Second, write the measurement plan during stage one, not stage six. Deciding after launch what success means guarantees the metrics will be chosen to flatter the project. Deciding before means the wireframes themselves get argued in terms of the number they are supposed to move, which is exactly the argument a redesign is for.
Key takeaway: Protect your winners. The single most common self-inflicted wound in SaaS redesigns is rewriting or de-linking the pages that were quietly producing pipeline, then spending two quarters wondering where it went.
AEO-Optimized Page Structure: Your Next Redesign Has Two Audiences
Any site you ship now must work for a second audience: the AI systems your buyers ask before they ever visit you. Forrester found 94% of B2B buyers use generative AI during the purchase process, and much of the evaluation happens where your analytics cannot see it. A redesign that ignores this ship’s pre-obsolete. The good news: the same structure that earns AI citations also converts skimming humans better.
- Answer-first sections: the first sentence under each heading answers the heading’s question outright, then expands. Buyers skim the way machines retrieve.
- Self-contained blocks: each section makes sense extracted alone, with the product and category named explicitly rather than referred to as “it.”
- Question-shaped headings on high-intent pages, phrased the way buyers actually ask assistants, with 40-to-80-word direct answers beneath.
- Structured data throughout: Organization, Product, FAQPage, and Person schema baked into templates, not bolted on after launch.
- Comparison content machines can lift accurately: honest tables, named criteria, and attributed claims, because unattributed superlatives get skipped by retrieval systems and buyers alike.
This matters most for SaaS because software categories are exactly where buyers lean on AI assistants to build shortlists. Making the redesign AEO-ready during the rebuild costs a fraction of retrofitting it later, since the work lives in templates and information architecture, the two things a redesign already touches.
A concrete example of the difference. The typical SaaS feature page opens with a metaphor and a hero line like “Work smarter, together.” The AEO-ready version opens with: “[Product] is a [category] tool that [does the specific job] for [the specific team]. Teams use it to [outcome one] and [outcome two].” A human skimmer, a search snippet, and an AI assistant can all use the second version. None of them can do anything with the first. You can keep the personality; it just cannot arrive before the answer.
Also Read: AI Overview Optimisation for B2B: How to Get Your Brand Cited in Google’s AI Answers
HubSpot CMS vs Headless: Choose for the Team You Have
The direct answer: HubSpot CMS (Content Hub) is the better choice for most B2B SaaS marketing teams because it keeps the website, CRM data, and conversion tooling in one system that marketers can operate without an engineering queue. Headless architectures earn their complexity when the site is genuinely part of the product experience or when engineering capacity is abundant and committed. The comparison that matters is not features, it is operating model:
| Dimension | HubSpot CMS (Content Hub) | Headless (e.g., React front end + headless CMS) |
|---|---|---|
| Who ships changes | Marketers; developers for templates and modules. | Developers for most structural changes; marketers within modeled content types. |
| Speed to launch pages | Hours to days, using approved modules. | Days to weeks unless a mature component library exists. |
| CRM and personalization | Native: forms, chat, smart content wired to the CRM record. | Custom integration work; powerful but built and maintained by you. |
| Performance ceiling | Strong and largely managed for you. | Highest ceiling, if the engineering discipline stays funded. |
| Total operating cost | License plus partner support; low internal engineering load. | Lower license, higher persistent engineering payroll. |
| Best fit | Marketing-led SaaS teams that iterate weekly. | Product-led companies treating the site as software. |
The honest caveat: HubSpot CMS is opinionated, and teams with unusual interactive requirements will hit its edges. If your roadmap includes a genuinely app-like web experience, interactive product tours built in code, or thousands of programmatically generated pages with complex logic, headless deserves the evaluation. What we push back on is choosing headless for prestige. A marketing site that needs an engineering sprint to change a headline converts worse in practice than a modest site the growth team can iterate on every week.
If you are already on HubSpot for CRM and marketing automation, the CMS decision carries one extra weight: keeping the website on the same platform means every page view, form fill, and chat conversation lands on the contact record without integration work, and smart content can adapt pages to known accounts. That native loop is hard to replicate cheaply in a headless stack, and it is exactly the plumbing that conversion-first measurement depends on. It is fair to note our bias here: as a HubSpot partner we build on Content Hub weekly. The operating-model logic above is the reasoning we would apply anyway, and it is testable against your own team’s shipping speed.
Measuring Website ROI: Prove the Redesign Paid for Itself
Website ROI is measured by comparing pipeline produced per visitor before and after the redesign, holding traffic sources as steady as the real world allows. That means the measurement plan has to exist before launch, with a clean baseline: at minimum, 90 days of pre-launch data on visitor-to-lead rate, lead-to-opportunity rate, demo-path completion, page speed, and organic visibility for money keywords.
| Metric | Why it matters | When to judge |
|---|---|---|
| Visitor-to-lead conversion rate | The headline number; benchmark against the 1.8% B2B average and 2.9% industry median. | 90 days post-launch. |
| Pipeline per 1,000 sessions | Normalizes for traffic swings; the truest redesign ROI metric. | 90–180 days. |
| Demo/trial path completion | Locates friction the aggregate rate hides. | 30 days, then ongoing. |
| Core Web Vitals / load time | Leading indicator; the speed-conversion link is well documented. | At launch, enforced ongoing. |
| Organic visibility and AI citations | Detects whether the rebuild protected (or grew) search equity. | 60–180 days. |
Add one qualitative instrument to the dashboard: a “how did you hear about us?” field on the demo form, free text rather than a dropdown. As more of the journey moves into AI assistants, communities, and dark social, click-path attribution captures a shrinking share of the truth. Self-reported answers are messy, but across engagements they surface influence the analytics never see, and they cost one form field.
Two warnings from experience. First, expect a temporary organic dip in the weeks after any migration; judge SEO impact at 60 to 90 days, not at week two, and make redirect mapping a launch-blocking deliverable so the dip stays temporary. Second, resist averaging your way to a verdict. A redesign that doubled conversion on product pages while the blog stayed flat is a success with a content problem, not a mediocre redesign. Judge templates, not the site.
What Conversion-First Looks Like in Results
Before: a digital adoption platform (DAP) SaaS company with real product strength but a web presence and demand engine that were not converting interest into qualified pipeline at the rate the category allows.
After: 112 marketing qualified leads, 20 sales qualified leads, and 5 closed deals from the engagement, using conservative counting (Smarketers Case-Studiest).
The bridge: the loop described above, applied end to start: message architecture rebuilt around buyer questions, conversion paths simplified with offers matched to intent levels, pages structured so both skimming humans and AI systems could extract answers, and measurement wired in from day one so the team optimized weekly instead of guessing quarterly. The same web practice was recognized in the Web Excellence Awards 2025, which we note as external validation, though the funnel numbers above are the evidence that actually matters.

When a Full Redesign Is the Wrong Move
Sometimes the conversion-first answer is: do not redesign. Three situations where we advise against the full rebuild. If your traffic is too small to measure differences, meaning a few thousand sessions a month, a redesign consumes the budget that demand generation should get first; fix the five highest-intent pages and spend the rest on getting found. If the site converts respectably and the real complaint is aesthetic fatigue inside the company, run a visual refresh on the existing architecture and protect the equity. And if leadership cannot agree on positioning, pause: a redesign executed mid-identity-crisis hard-codes the confusion into templates. Fix the message first, then the site. The redesign multiplies whatever clarity, or chaos, you feed it.
Smarketers Web Development Services
We build conversion-first B2B websites as an integrated practice: revenue teardown, message architecture, HubSpot CMS build (we are a HubSpot Platinum Solutions Partner), AEO-ready structure aligned with our B2B SEO, AEO, and GEO services, and post-launch optimization tied to the demand generation programs the site feeds. Recognition like the Web Excellence Awards 2025 is welcome; the metric we sign up for is pipeline per visitor.
Next step: Get a Website Audit: a teardown of your current conversion paths, speed, and AEO readiness, with the fixes ranked by pipeline impact, before you commit a redesign budget.
Frequently Asked Questions
How long should a B2B SaaS website redesign take?
For a conversion-first redesign of a typical SaaS marketing site, expect three to five months from teardown to launch: several weeks of strategy and message architecture, several weeks of wireframes and design, and the balance in build, migration, and QA. Timelines stretch when positioning is unsettled, not when pages are numerous.
What budget should we plan for?
Budgets vary too widely by scope and region to quote responsibly, so plan by proportion instead: reserve meaningful budget for the strategy and measurement phases (not just design and build), and keep 10-15% for post-launch optimization. A redesign with nothing left for iteration abandons its highest-return window.
Will a redesign hurt our existing SEO?
It can, temporarily and sometimes permanently, if redirects and content parity are treated casually. Make one-to-one redirect mapping a launch-blocking deliverable, preserve or improve your best-performing pages, and expect a short dip that recovers within 60 to 90 days if the migration was disciplined.
Should we redesign in one launch or page by page?
Phased launches win more often for SaaS: ship the new architecture on the highest-intent templates first (home, product, pricing, demo path), measure, then roll out. A big-bang launch is justified when the brand change is drastic enough that mixing old and new would confuse buyers.
What conversion rate should a B2B SaaS site aim for?
Anchor on the published benchmarks: 1.8% is the B2B average, 2.9% the cross-industry median, 3% is good, and 5%+ is strong for higher-ACV companies, with SaaS spanning roughly 1.1% to 7% by ACV and motion. Your own trend matters more than the absolute: pipeline per thousand sessions, improving quarter over quarter.
Do we need new content for the redesign, or can we migrate what we have?
Audit first: keep and lightly restructure pages with proven conversion or search equity, rewrite pages whose message no longer matches your positioning, and delete the rest. Most SaaS sites need far more restructuring than net-new writing, which is cheaper and faster than teams expect.
What are the prerequisites before starting a conversion-first redesign?
Three things: agreed positioning at the leadership level, at least 90 days of clean baseline analytics on your current conversion paths, and a named owner for post-launch optimization. Without the third, even a well-built site plateaus at whatever it converts on launch day.
How soon after launch should we expect conversion improvement?
Path-level improvements (faster pages, shorter forms, clearer CTAs) show within 30 days. Judge the headline visitor-to-lead rate at 90 days, and pipeline impact at 90 to 180 days given SaaS sales cycles. Anything claimed sooner is usually a traffic-mix artifact, not a redesign effect.

Krishna
Director of Strategy & Delivery