Table of Contents
- Why Most MQLs Never Become Pipeline: What the Data Shows
- What Replaces the MQL: Buying-Group Qualification
- Pipeline Velocity: The North Star Metric That Replaces Lead Counts
- How to Restructure Your Funnel: The Pipeline-First Transition Framework
- The Smarketers Pipeline-First Approach: A Case Study
- When Killing the MQL Is the Wrong Move
- Where to Start This Quarter
- Frequently Asked Questions
Need help with B2B Marketing?
Let the smarketers’ team drive your pipeline with data-led campaigns and AI-powered growth strategies.
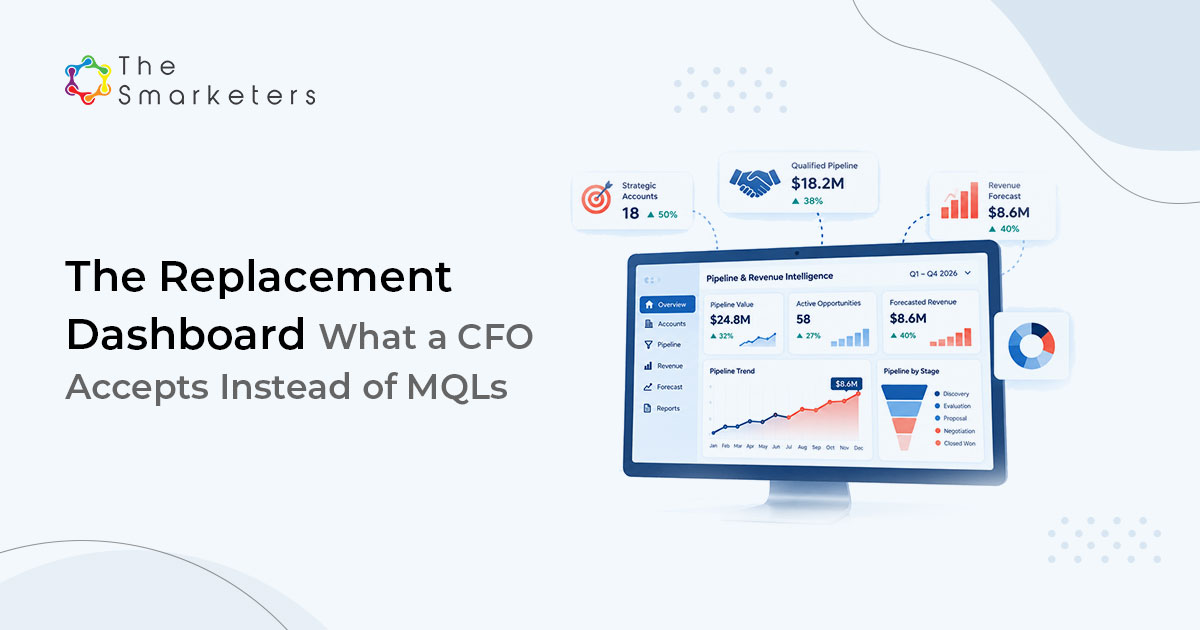
Your team delivered 412 MQLs last quarter. Sales accepted 60, worked 25, and closed 3. In the board meeting, marketing celebrated the 412 and sales questioned the 3, and both sides were describing the same funnel. That argument, repeated in thousands of B2B companies every quarter, is why the marketing qualified lead is finally losing its seat as the primary marketing metric.
The MQL is not dying because marketers got bored of it. It is dying because the buying behavior it was built to measure no longer exists. The MQL model assumes an individual raises a hand early, gets nurtured, and is passed to sales while the decision is still open. The data says the opposite now happens: roughly 95% of the time, the vendor that wins was already on the buyer’s day-one shortlist, and about 80% of buyers contact the vendor they intend to buy from first. By the time a form is filled, the decision is largely formed.
This article lays out what the data actually shows about lead-based funnels, what replaces the MQL (buying-group qualification and pipeline velocity), and a six-step framework for making the transition without blowing up your reporting mid-year. It is written from the demand generation programs we run at The Smarketers, including one that replaced MQL targets entirely and produced 300+ sales opportunities in four weeks. We also cover when retiring the MQL is the wrong move, because it sometimes is.
Why Most MQLs Never Become Pipeline: What the Data Shows
Most MQLs never become pipeline because they measure individual curiosity, not group intent. A whitepaper download tells you one person was interested in a topic for ninety seconds. It tells you nothing about whether an account has a budget, a problem worth solving, or the eleven other people who will weigh in on the decision.
Consider the arithmetic that MQL dashboards hide. Only about 3% of B2B website visitors ever convert to a form-fill, and up to 90% of identifiable account visitors stay anonymous through the entire journey. So the MQL model scores the small visible sliver of buying activity and ignores the rest. Meanwhile the visible sliver is expensive: the average B2B cost per sales qualified lead reached $1,357 in FY2024 benchmarks, and the median B2B conversion rate sits at just 2.9% across 100M+ tracked sessions. Teams are paying enterprise prices for a metric that filters out most of the market.

Then there is the timing problem. Forrester’s research has consistently shown that 70-80% of the buyer journey happens before first vendor contact. Gartner’s June 2025 survey found 61% of B2B buyers prefer a rep-free buying experience, a figure that climbed to 67% by March 2026. A metric designed to trigger a sales call on an early hand-raise is structurally mismatched with buyers who do most of the work alone and call last.
What Replaces the MQL: Buying-Group Qualification
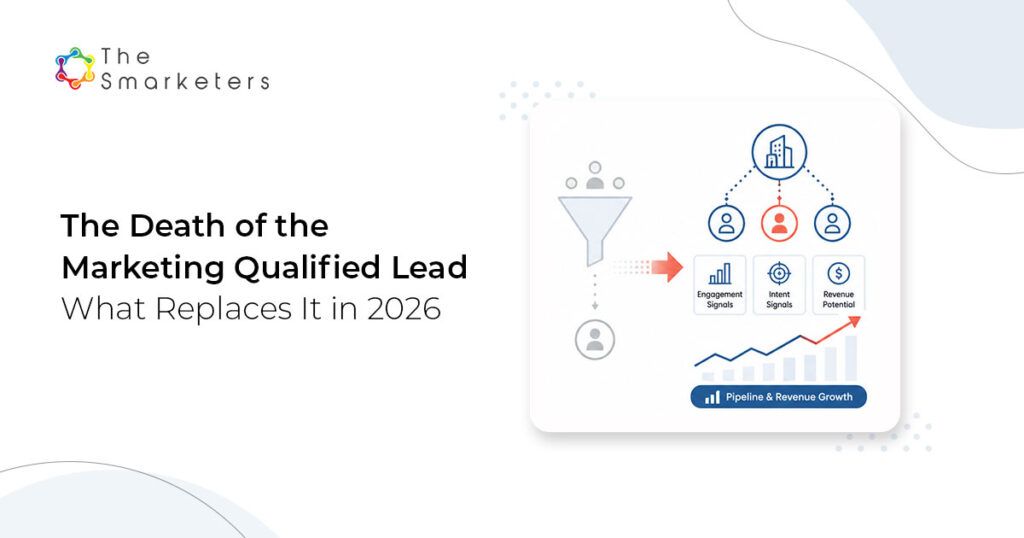
The replacement for the MQL is account-level qualification of the buying group: scoring the collective engagement of the people who will actually make the decision, rather than the form-fill of any one of them. Some teams operationalize this as a Marketing Qualified Account (MQA), others as a Sales Qualified Attention or opportunity-stage signal. The label matters less than the unit of measurement: the account and its buying group, not the individual lead.
The size of the buying group is what makes this non-negotiable. The median B2B buying group now includes 11.2 people for deals over $50K, up from 9.7 in 2024. Buyers also consume 8-13 pieces of content before engaging sales. One MQL from that group is a keyhole view of an eleven-person conversation. Buying-group qualification widens the keyhole: it aggregates page visits, content consumption, ad engagement, event attendance, and intent signals across every known and inferred member of the account.
In practice, the shift changes four things at once:
| Dimension | Lead-based (MQL) model | Buying-group model |
|---|---|---|
| Unit of qualification | Individual contact who filled a form | Account with multi-person engagement above the threshold |
| Trigger for sales | Lead score crosses points threshold | Buying-group coverage + intent signals + fit criteria |
| Core marketing KPI | MQL volume per quarter | Qualified accounts, opportunities created, pipeline velocity |
| Failure mode | High volume, low conversion, sales distrust | Slower to instrument; needs shared definitions with sales |
Note the last row. Buying-group marketing has its own failure mode, and pretending otherwise is how transitions stall. It requires account-level data plumbing, agreed definitions with sales, and patience while the new baseline forms. Teams that switch the metric without switching the plumbing end up with a renamed MQL and the same argument in the board meeting.
Pipeline Velocity: The North Star Metric That Replaces Lead Counts
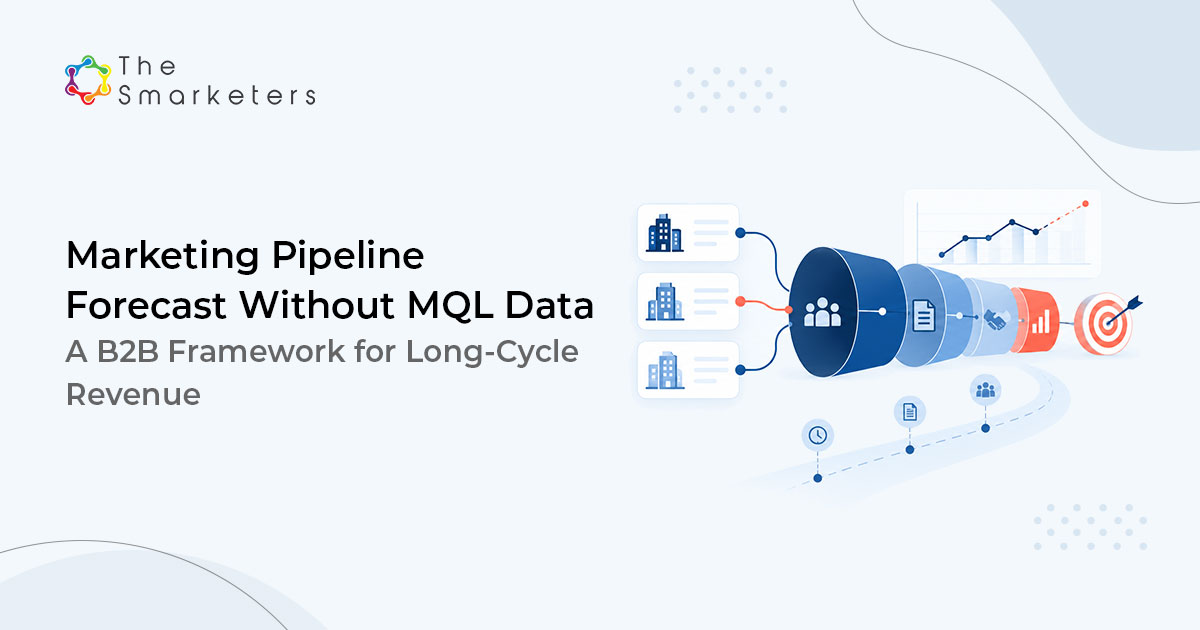
Pipeline velocity measures how much revenue your pipeline produces per unit of time. The standard formula: qualified opportunities multiplied by win rate multiplied by average deal size, divided by sales cycle length. It is the single best replacement for the MQL as a headline metric because every input is something marketing can influence and sales cannot dispute.
Velocity also reframes marketing’s job. Under MQL targets, marketing’s job ends at the handoff. Under velocity, marketing owns four levers: create more qualified opportunities (demand programs), improve win rate (better-fit accounts, buying-group coverage), increase deal size (multi-threading into economic buyers), and shorten cycles (answering the buying group’s questions before sales meetings instead of during them). You can model your own numbers with our pipeline velocity calculator.
This is why the shift to pipeline metrics usually arrives together with a Revenue Operations model, where marketing, sales, and customer success share one revenue engine and one set of definitions. The commercial case is well documented: companies with RevOps functions report 36% more revenue growth and up to 28% higher profitability, and public companies with dedicated RevOps saw 71% higher stock performance. Gartner projected that 75% of the highest-growth companies would run a RevOps model by 2025, up from under 30%. The MQL rarely survives that reorganization, because a shared revenue engine has no use for a metric only one team believes in.
Key stat:Companies with RevOps see 36% more revenue growth and up to 28% more profitability than peers without it. (Source: BCG/Forrester figures via Qwilr RevOps statistics)
A worked example makes the metric concrete. Suppose your team creates 40 qualified opportunities a quarter, wins 25% of them, at an average deal size of $60K, on a 120-day cycle. Velocity is 40 x 0.25 x 60,000 / 120, or $5,000 of pipeline-produced revenue per day. Now compare two initiatives: a campaign that adds 10% more opportunities moves velocity to $5,500 per day, while a buying-group content program that trims the cycle from 120 to 100 days moves it to $6,000. Under MQL reporting those two programs are not even comparable; under velocity, the trade-off is arithmetic. That is what a north star metric is supposed to do: make prioritization boring.
The adoption trend matters for timing, too. With roughly half of companies now running dedicated RevOps functions, up from 33% in 2020, pipeline-denominated reporting is quickly becoming the default expectation among boards and investors. Teams still defending MQL dashboards are increasingly explaining a metric their audience has stopped using elsewhere.
Related Reads: Learn the RevOps Strategies Modern B2B Teams Use to Scale.
How to Restructure Your Funnel: The Pipeline-First Transition Framework
How do you actually retire from the MQL? Gradually, in parallel, and with sales in the room from day one. The Pipeline-First Transition Framework below is the sequence we use in client engagements. Most teams complete it in two to three quarters; attempting it in one is the most common cause of failure we see.
- Baseline your funnel math. Before changing anything, trace the last four quarters of MQL cohorts through to closed revenue: MQL to SQL rate, SQL to opportunity rate, win rate, revenue per MQL. This number is usually uncomfortable, and it is the business case for everything that follows. Our MQL-to-SQL conversion calculator makes this a one-afternoon exercise.
- Define buying-group qualification with sales. Write the qualified-account definition together: fit criteria (industry, size, tech stack), engagement threshold (how many people, which roles, what actions), and intent signals. If sales does not co-author the definition, they will not trust the accounts it produces, and you will have rebuilt the MQL argument under a new name.
- Instrument pipeline velocity. Stand up the four velocity inputs in your CRM as a single dashboard: opportunities created, win rate, average deal size, cycle length. Segment by source and by account tier. This dashboard becomes the new board slide.
- Rebuild the marketing-sales handoff. Replace lead routing with account routing. A qualified account arrives with its full engagement history: who engaged, with what, when. The first sales touch should read like a continuation of the conversation, not a cold start.
- Re-anchor reporting on revenue metrics. Report opportunities created, pipeline velocity, and revenue per account upward for two consecutive quarters alongside the old MQL numbers. Boards accept metric changes when the new metric is presented with history, not as a mid-year surprise.
- Retire the MQL gradually. Once the buying-group model has two quarters of data and sales acceptance is above your agreed threshold, drop MQL targets from compensation and board reporting. Keep the underlying activity data; stop treating it as the goal.

The Smarketers Pipeline-First Approach: A Case Study
A Fortune 500 industrial automation company came to us with a version of the opening scene of this article: strong lead volume from events and content syndication, weak pipeline, and a sales organization that had quietly stopped following up on marketing leads. The mandate was explicit: stop reporting leads, start creating opportunities.
We rebuilt the program as an account-based demand engine. Target accounts were selected with sales on fit and intent, qualification moved to buying-group engagement across roles (operations, engineering, procurement), and the program was measured on opportunities created and cost per opportunity rather than lead counts. Creative and offers changed too: fewer gated PDFs, more application-specific content the buying group could circulate internally.
Result: 300+ sales opportunities created in 4 weeks, with cost per lead cut by 90% against the prior program. (Smarketers client engagement; full story at thesmarketers.com/success-stories)

The honest caveat: this client had a large addressable account list, an active sales team, and deal sizes that justified account-level attention. The same program pointed at a $3K ACV product with a self-serve motion would have been overkill. The model transfers; the economics have to be checked first.
Common mistakes during the transition
- Renaming instead of re-instrumenting. Calling the same form-fill threshold an “MQA” changes nothing. If one person can trigger qualification, the unit of measurement has not moved.
- Switching the board metric before the sales metric. If sales acceptance criteria still reference lead scores, the funnel splits into two languages and reporting arguments get worse, not better.
- Dropping activity tracking entirely. Form-fills, downloads, and webinar attendance remain useful diagnostic inputs to account scoring. Retiring the target does not mean deleting the data.
- No agreed definition of “opportunity.” If marketing counts created opportunities and sales counts accepted ones, velocity becomes two dashboards that disagree. Define the stage gates once, together, in writing.
When Killing the MQL Is the Wrong Move
Retiring the MQL is not a universal upgrade. Keep lead-based measurement, at least in part, if any of these describe you:
- High-volume, low-ACV motions. If your average deal closes under roughly $10-15K with one or two decision makers, individual lead scoring still maps to reality. Buying-group instrumentation would add cost without adding signal.
- No sales capacity to work accounts. Account-based qualification produces fewer, richer handoffs that demand proper multi-threaded follow-up. A two-person sales team drowning in territory cannot execute it, and the model will be blamed for a capacity problem.
- Immature data infrastructure. If your CRM cannot reliably associate contacts to accounts or track engagement at the account level, fix that first. A buying-group model on broken plumbing produces numbers nobody trusts, which is the exact disease you are trying to cure.
- Mid-year, mid-target. If compensation and board targets are set on MQLs through December, run the new model in parallel and switch at the planning boundary. Changing the scoreboard mid-game costs credibility even when the new scoreboard is better.
One more honest note: MQLs still have a legitimate job as an early diagnostic of content and channel performance. The mistake was never treating a diagnostic as a goal. Keep the measurement; retire the target.
Where to Start This Quarter
Run the baseline exercise this week: four quarters of MQL cohorts traced to revenue. That single spreadsheet usually settles the internal debate faster than any article, this one included.
If the math tells you what it tells most teams, and you want help designing the buying-group model, the velocity dashboard, and the transition plan, learn about pipeline-first marketing. It is the same approach behind the 300-opportunity program above.
Frequently Asked Questions
How long does the transition from MQLs to a pipeline-first model take?
Plan for two to three quarters. One quarter to baseline and define buying-group qualification with sales, then two quarters of running both models in parallel before MQL targets are formally retired. Teams that attempt the switch in a single quarter usually lose sales trust or board confidence midway.
What does a buying-group qualification threshold actually look like?
A typical starting definition: an account matching your fit criteria where three or more people from at least two functions have engaged in the last 30 days, with at least one engagement from a decision-making role. The exact numbers matter less than sales co-authoring them.
Do we need new tools to measure buying groups and pipeline velocity?
Not necessarily. Most teams can build a first version in their existing CRM and marketing automation platform by enforcing contact-to-account association and building account-level engagement rollups. Intent data platforms help identify anonymous research but are an accelerator, not a prerequisite.
What should marketing be compensated on if not MQLs?
Opportunities created and pipeline value influenced are the most common replacements, sometimes with a velocity or revenue component for senior roles. Avoid compensating on closed revenue alone in long-cycle businesses; the feedback loop is too slow to steer quarterly work.
How do we report this change to a board that expects MQL numbers?
Show both metrics side by side for two quarters with the cohort math that connects them: this many MQLs historically produced this much revenue, versus this many qualified accounts producing this much pipeline. Boards respond to revenue-denominated metrics; the resistance is usually to surprise, not to the metric itself.
Is the MQA just the MQL with a different name?
It can be, and that is the failure mode to avoid. The difference is the unit of measurement and the trigger: an MQA fires on multi-person account engagement against fit and intent criteria, not on one individual crossing a points threshold. If your MQA definition can be satisfied by a single form-fill, it is a renamed MQL.
What budget does a pipeline-first program need compared to lead gen?
Media budgets often stay flat or drop, because spend concentrates on fewer, better-fit accounts. Benchmarks put blended B2B cost per lead around $198 and cost per SQL at $1,357, so the real question is cost per opportunity, which account-based programs frequently improve. The added investment is usually in data quality and sales-marketing alignment time, not media.
What KPIs prove the new model is working in the first 90 days?
Leading indicators: buying-group coverage in target accounts (how many roles engaged), sales acceptance rate of qualified accounts, and meetings created per account. Velocity and revenue effects show up in quarters two and three; judging the model on closed revenue in the first 90 days sets it up to fail.

Enoch Pakanati
CEO